You Might Also Like
Learn Coding Visually
Learn to code with interactive, live-preview playgrounds — HTML, CSS, JavaScript, React & more.
 HTML Playground42 lessons · Click-based · Live preview
 CSS PlaygroundLearn CSS with a live editor
 JavaScript Playground60 lessons · DOM · Async · Canvas
 React PlaygroundLearn React with a live code editor
 GSAP PlaygroundLearn GSAP animation interactively
 SVG Playground44 lessons · shapes · paths · animation
 SCSS Playground45 lessons · Sass modules · tokens
 Tailwind PlaygroundLearn Tailwind CSS with a live editor
 Bootstrap 5 Playground50 lessons · live preview
D3 Force Bubble Chart — Draggable Clustered Bubbles
D3 Force Bubble Chart · Charts · Plain HTML, CSS & JS · Live preview
What's included
Features
About this UI Snippet
D3 Force Bubble Chart — Simulations, Alpha, and Honest Circle Sizing
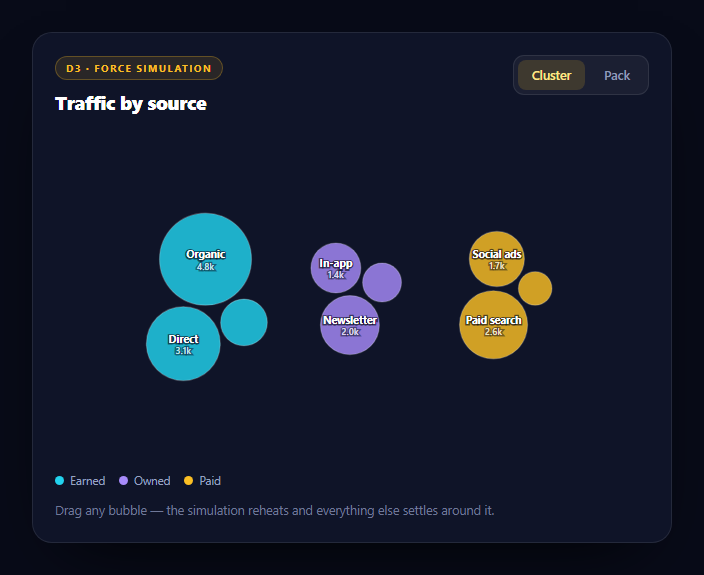
A force simulation is not a chart type — it is a tiny physics engine. You describe forces you want acting on a set of nodes, and D3 iteratively nudges them until the whole system reaches equilibrium. That makes it the right tool whenever a layout has no single correct answer, only constraints: bubbles that must not overlap, cluster near their category, and stay inside the frame.
The scale that keeps the chart honest
This line is the difference between a truthful chart and a misleading one:
var r = d3.scaleSqrt().domain([0, max]).range([0, 46]);
Humans read a circle's area, not its radius. If radius were mapped linearly, a value twice as large would produce a circle with four times the area — visually claiming a 4× difference where the data says 2×. Taking the square root makes area proportional to value, which is exactly why scaleSqrt exists in D3 and why it should be the default choice for any circle-sized encoding.
Forces, and why there are three
.force('x', d3.forceX(...).strength(...)) — pulls each node toward a target x. In cluster mode that target is derived from the node's category, so groups separate horizontally; in pack mode every node targets the center and the groups merge.
.force('y', d3.forceY(height / 2).strength(0.12)) — a gentle vertical pull toward the middle. Its strength is deliberately higher than the x force in pack mode so the arrangement stays wide and shallow rather than becoming a tall column.
.force('collide', d3.forceCollide(d => d.r + 2).iterations(3)) — the force doing the actual packing. iterations is worth knowing about: collision resolution is approximate, and at the default of 1 large bubbles visibly overlap because one pass is not enough to satisfy every constraint. Raising it to 3 costs a little per tick and produces clean separation. The + 2 is the visual gutter between circles.
Alpha: the concept that trips everyone up
A D3 simulation has an internal alpha value — its energy. It starts near 1 and decays each tick until it drops below a threshold, at which point the simulation stops. That is what makes a layout settle instead of jittering forever.
It is also why changing a force appears to do nothing:
sim.alpha(0.9).restart();
If the simulation has already cooled, adding a new force has no effect — there is no energy left to move anything. Reheating with alpha() and calling restart() gives it the budget to rearrange. Nearly every "my D3 force layout is not responding to my update" question has this as its answer.
Dragging uses a different mechanism on purpose:
sim.alphaTarget(0.3).restart() on drag start, sim.alphaTarget(0) on end.
alphaTarget sets the value alpha *decays toward*. Setting it to 0.3 keeps the simulation permanently warm for as long as the drag lasts, so other bubbles keep reacting continuously. Returning it to 0 lets everything cool and settle again. Using alpha() here instead would give one burst of energy that fades mid-drag.
fx and fy pin a node
During a drag the node gets d.fx and d.fy — fixed positions that override the simulation entirely for that node. It follows the pointer exactly while every other bubble negotiates around it. Setting them back to null on release returns the node to the simulation's control, which is what makes it drift into a resting position rather than freezing where it was dropped.
Clamping inside the tick
The tick handler clamps each node's position to the frame before writing the transform:
d.x = Math.max(d.r, Math.min(width - d.r, d.x));
Doing this in the tick rather than adding a boundary force is simpler and absolute — no bubble can ever escape, even momentarily during a fast drag.
Selections and joins
svg.selectAll('g.dfb-node').data(nodes).join('g') uses the modern join() API rather than the older enter/exit dance. Each node is a <g> containing a circle and two text labels, so one translate on the group moves everything together — cheaper and simpler than positioning three elements individually every tick.
Labels are only rendered when the bubble is large enough to hold them (d.r > 24), and use paint-order: stroke with a dark stroke so text stays readable over any fill color. A <title> child gives every bubble a native tooltip with its exact value, which also makes the chart usable with a screen reader.
Reusing it
Replace DATA, GROUPS, and COLOR; everything else derives. For hierarchical data where bubbles nest inside parents, D3's pack() layout is a better fit than a force simulation. Compare with a bubble chart for the positioned variant, or a treemap when exact area comparison matters more than grouping.
Build with AI
Build, Understand, Optimize, and Extend It With AI
Force simulations have one concept that explains most of the confusion around them, and it is worth having named explicitly. Paste the HTML, CSS, and JS into an AI assistant like Claude and ask it to explain what alpha is, how it decays, and why sim.alpha(0.9).restart() is required after changing a force — then remove that call and watch the mode toggle silently do nothing. Ask it to contrast alpha with alphaTarget and explain why the drag handler uses the latter. Then ask why the radius uses d3.scaleSqrt rather than scaleLinear, and have it work through the numbers for a value twice as large to show the 4x area distortion a linear scale would introduce. For optimization, ask what forceCollide's iterations parameter actually does per tick and how you would tune it for a hundred bubbles rather than nine. To extend it: have it animate radius changes when the data updates, add a category filter that removes nodes and reheats, replace the cluster force with forceCenter per group, or add keyboard-accessible focus for each bubble. Treat the code less like a finished artifact and more like a starting point for a conversation.
Prompt to recreate it
Copy this into your AI assistant of choice to build the effect from scratch, or as a jumping-off point for your own variant:
Build a draggable force-directed bubble chart with D3 v7 (from a CDN, global d3) in plain HTML, CSS, and JavaScript.

Requirements:
- Size bubbles with d3.scaleSqrt, NOT scaleLinear, and explain why in a comment: people compare circles by area, so mapping value linearly to radius makes a 2x value appear 4x larger. The square root makes area proportional to value.
- Build a d3.forceSimulation with three forces: a forceX whose target depends on the current mode, a forceY pulling toward vertical center with a slightly higher strength so the layout stays wide rather than becoming a tall column, and a forceCollide sized to each node radius plus a small gutter. Set the collide force's iterations to 3 and explain that collision resolution is approximate — at the default of 1 large bubbles visibly overlap because one relaxation pass cannot satisfy every constraint.
- Provide two layout modes: "cluster" where the forceX target is derived from each node's category so groups separate horizontally, and "pack" where every node targets the center so groups merge. When switching modes you MUST call sim.alpha(0.9).restart() and explain why: alpha is the simulation's energy and decays to zero as the layout settles, so a cooled simulation ignores a newly applied force entirely — this is the single most common D3 force confusion.
- Implement dragging with d3.drag, setting d.fx and d.fy to pin the node to the pointer and clearing them to null on release. On drag start call sim.alphaTarget(0.3).restart() and on end sim.alphaTarget(0) — explain that alphaTarget sets the value alpha decays TOWARD, so it keeps the simulation warm for the whole drag, whereas alpha() would give a single burst that fades mid-gesture.
- In the tick handler, clamp each node's x and y to within the SVG bounds accounting for its radius before writing the transform, so bubbles can never escape the frame even during a fast drag.
- Render each node as a single <g> containing a circle and two text labels, so one translate per tick moves everything together rather than positioning three elements separately. Only render labels when the bubble is large enough to contain them, and use paint-order: stroke with a dark stroke so text stays readable over any fill.
- Add a native SVG <title> child to each node giving the exact value, so hovering shows an unrounded tooltip and screen readers can access the data.
- Use the modern selection.data(...).join(...) API rather than the older enter/exit pattern, derive the legend from the group list, and style it as a dark dashboard card.
Want to tighten it up first? Run this prompt through the AI Prompt Studio to score it across 8 quality dimensions, catch anti-patterns, and tune the wording for Claude, ChatGPT, or Gemini before you paste it in.
Step by step
How to Use
- 1Add the D3 CDNInclude d3 v7 from the CDN panel — global d3.
- 2Paste HTML, CSS, and JSBubbles drop in and settle into three category clusters.
- 3Switch to PackThe x force retargets to center and the simulation reheats to rearrange.
- 4Drag a bubbleIt pins to your pointer while the rest renegotiate around it.
- 5Hover for exact valuesNative SVG titles show the unrounded number.
- 6Swap in your dataReplace DATA, GROUPS and COLOR — scales and legend derive from them.
Real-world uses
Common Use Cases
Got questions?
Frequently Asked Questions
People compare circles by area, not radius. Mapping value linearly to radius means a value twice as large draws a circle with four times the area, visually overstating the difference. Taking the square root makes area proportional to value, which is why scaleSqrt exists and why it should be the default for any circle-sized encoding.
Because the simulation has already cooled. D3 keeps an internal alpha value that decays each tick until the simulation stops, which is what lets a layout settle. Once alpha reaches zero there is no energy left to move nodes, so a new force has no visible effect. Calling sim.alpha(0.9).restart() reheats it so the layout can rearrange.
alpha sets the current energy, which then decays — a single burst. alphaTarget sets the value alpha decays toward, so setting it to 0.3 keeps the simulation permanently warm for as long as a drag lasts, letting other bubbles react continuously. Resetting it to 0 on drag end lets the layout cool and settle again.
They pin a node to a fixed position, overriding the simulation for that node only, so it follows the pointer exactly while every other bubble negotiates around it. Setting them back to null on release hands the node back to the simulation, which is why it drifts into a resting position rather than freezing where it was dropped.
Collision resolution is approximate and runs a fixed number of relaxation passes per tick. At the default of 1, large circles visibly overlap because one pass cannot satisfy every constraint at once. Three iterations costs slightly more per tick and produces clean separation, which matters most when bubble sizes vary a lot.
Let the framework render the SVG container and let D3 own the node subtree, or render nodes from state and use D3 only for the simulation math. Create the simulation in a mount effect and call sim.stop() in cleanup, or it keeps ticking against detached nodes. Keep the nodes array in a ref since d3-force mutates x, y, vx and vy in place on every tick.