Source Code
<div class="container py-5">
  <div class="row g-3">
    <div class="col-6 col-lg-3">
      <div class="card h-100 bds-card">
        <div class="card-body">
          <div class="d-flex justify-content-between align-items-start mb-2">
            <div class="bds-icon bg-primary-subtle text-primary">$</div>
            <span class="badge text-bg-success-subtle text-success bds-trend">▲ 12.4%</span>
          </div>
          <div class="fs-3 fw-bold" id="bdsRevenue" data-target="48250" data-prefix="$">0</div>
          <div class="text-muted small">Total Revenue</div>
        </div>
      </div>
    </div>
    <div class="col-6 col-lg-3">
      <div class="card h-100 bds-card">
        <div class="card-body">
          <div class="d-flex justify-content-between align-items-start mb-2">
            <div class="bds-icon bg-info-subtle text-info">U</div>
            <span class="badge text-bg-success-subtle text-success bds-trend">▲ 8.1%</span>
          </div>
          <div class="fs-3 fw-bold" id="bdsUsers" data-target="3184" data-prefix="">0</div>
          <div class="text-muted small">Active Users</div>
        </div>
      </div>
    </div>
    <div class="col-6 col-lg-3">
      <div class="card h-100 bds-card">
        <div class="card-body">
          <div class="d-flex justify-content-between align-items-start mb-2">
            <div class="bds-icon bg-warning-subtle text-warning">O</div>
            <span class="badge text-bg-danger-subtle text-danger bds-trend">▼ 3.2%</span>
          </div>
          <div class="fs-3 fw-bold" id="bdsOrders" data-target="912" data-prefix="">0</div>
          <div class="text-muted small">Orders</div>
        </div>
      </div>
    </div>
    <div class="col-6 col-lg-3">
      <div class="card h-100 bds-card">
        <div class="card-body">
          <div class="d-flex justify-content-between align-items-start mb-2">
            <div class="bds-icon bg-danger-subtle text-danger">%</div>
            <span class="badge text-bg-success-subtle text-success bds-trend">▲ 1.6%</span>
          </div>
          <div class="fs-3 fw-bold" id="bdsConversion" data-target="4.8" data-prefix="" data-suffix="%" data-decimals="1">0%</div>
          <div class="text-muted small">Conversion Rate</div>
        </div>
      </div>
    </div>
  </div>
</div>
.bds-card { border: 1px solid #eceef1; border-radius: 14px; }
.bds-icon { width: 40px; height: 40px; border-radius: 10px; display: flex; align-items: center; justify-content: center; font-weight: 700; }
.bds-trend { font-weight: 600; font-size: 0.72rem; }function formatNumber(value, decimals) {
return value.toLocaleString('en-US', { minimumFractionDigits: decimals, maximumFractionDigits: decimals });
}
function animateCount(el) {
const target = parseFloat(el.getAttribute('data-target'));
const prefix = el.getAttribute('data-prefix') || '';
const suffix = el.getAttribute('data-suffix') || '';
const decimals = parseInt(el.getAttribute('data-decimals') || '0', 10);
const duration = 1200;
let startTime = null;
function step(timestamp) {
if (startTime === null) startTime = timestamp;
const progress = Math.min((timestamp - startTime) / duration, 1);
const eased = 1 - Math.pow(1 - progress, 3);
const current = target * eased;
el.textContent = prefix + formatNumber(current, decimals) + suffix;
if (progress < 1) {
requestAnimationFrame(step);
} else {
el.textContent = prefix + formatNumber(target, decimals) + suffix;
}
}
requestAnimationFrame(step);
}
document.querySelectorAll('[data-target]').forEach(animateCount);Learn Coding Visually
Learn to code with interactive, live-preview playgrounds — HTML, CSS, JavaScript, React & more.
 HTML Playground42 lessons · Click-based · Live preview
 CSS PlaygroundLearn CSS with a live editor
 JavaScript Playground60 lessons · DOM · Async · Canvas
 React PlaygroundLearn React with a live code editor
 GSAP PlaygroundLearn GSAP animation interactively
 SVG Playground44 lessons · shapes · paths · animation
 SCSS Playground45 lessons · Sass modules · tokens
 Tailwind PlaygroundLearn Tailwind CSS with a live editor
 Bootstrap 5 Playground50 lessons · live preview
Bootstrap Dashboard Stat Cards — Free HTML CSS JS Snippet
Bootstrap Dashboard Stat Cards · Dashboards · Plain HTML, CSS & JS · Live preview
What's included
Features
About this UI Snippet
Bootstrap Dashboard Stat Cards — HTML, CSS & JavaScript
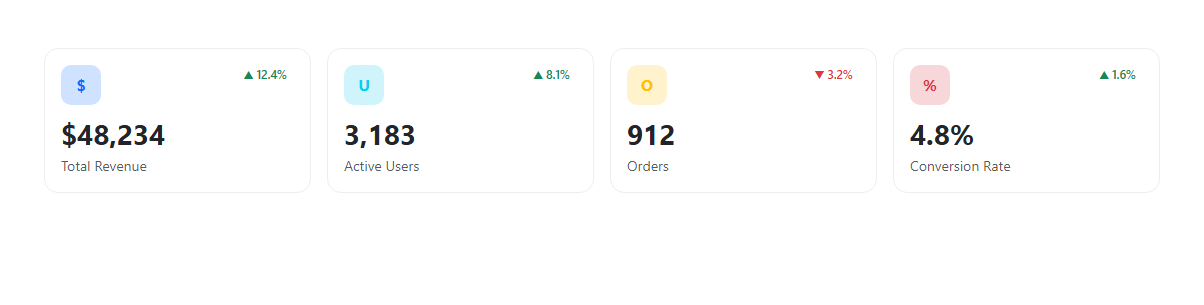
Dashboards feel alive when their headline numbers arrive with motion instead of appearing as static text, and this snippet builds that count-up effect on real requestAnimationFrame timing rather than a fixed-step setInterval, which is what keeps the animation smooth regardless of the display's refresh rate. Each of the four cards is a standard Bootstrap card inside a responsive row g-3, with a small colored .bds-icon square (built from Bootstrap's bg-*-subtle and text-* utility classes, not custom hex colors) and a trend badge using text-bg-success-subtle/text-bg-danger-subtle to color-code whether the metric moved up or down.
All animation configuration lives in data attributes on the big-number element itself: data-target (the final value), data-prefix/data-suffix (for the $ on revenue or the % on conversion rate), and data-decimals (so the conversion-rate card animates to one decimal place — 4.8% — while the integer cards animate to whole numbers). The animateCount() function reads all four attributes once, then drives a step() function through requestAnimationFrame: on the first frame it captures a startTime, then on every subsequent frame computes progress as the elapsed time over a fixed 1200ms duration, clamped to 1 with Math.min. Rather than animating linearly, progress is run through a cubic ease-out curve — 1 - Math.pow(1 - progress, 3) — so the count starts fast and settles gently into its final value instead of stopping abruptly, which reads as noticeably more polished than a linear ramp.
Each frame's value is formatted with toLocaleString, passing minimumFractionDigits/maximumFractionDigits from data-decimals so intermediate frames of the integer cards never flash a stray decimal, and the thousand-separator commas appear automatically for values like 48,250. The loop terminates by explicitly writing the exact target value (not the last eased approximation) once progress reaches 1 — the non-obvious edge case here is that floating-point easing math can land a whisker below the true target (e.g. 4.7999999 instead of 4.8), so snapping to the literal target attribute on completion guarantees the displayed number is always exactly correct, not an animation artifact.
Because every card is discovered generically via document.querySelectorAll('[data-target]') rather than four hardcoded element references, adding a fifth stat card requires zero JavaScript changes — just a new element with its own data-target. That same generic, attribute-driven approach is what makes the animation trivial to port into React (call it from useEffect per ref), Vue (onMounted), or Angular (ngAfterViewInit) since it only ever reads a DOM node's attributes and writes its textContent.
Build with AI
Build, Understand, Optimize, and Extend It With AI
Ask an AI coding assistant like Claude to add a small inline sparkline chart under each number using only SVG, or to make the animation replay when a card scrolls into view via an IntersectionObserver instead of firing immediately on load. It's also worth asking it to add a loading skeleton state before the real data arrives.
Prompt to recreate it
Copy this into your AI assistant of choice to build the effect from scratch, or as a jumping-off point for your own variant:
Build four Bootstrap 5.3 dashboard stat cards using the real Bootstrap CDN (bootstrap.min.css and bootstrap.bundle.min.js), not custom CSS made to resemble Bootstrap.

Requirements:
- Each card shows a small colored icon square, a large number, a label, and a colored trend badge (green up arrow or red down arrow with a percentage), all built from real Bootstrap card, subtle background, and badge classes.
- Each big number must count up from 0 to its target value using requestAnimationFrame (not setInterval), with an eased deceleration curve rather than linear motion, over roughly 1.2 seconds.
- Animation configuration (target value, optional prefix like $, optional suffix like %, and decimal places) must be driven by data attributes on the number element, and any new card added the same way must animate automatically without JS changes.
- The final displayed value must exactly equal the configured target, with no floating-point rounding artifacts from the easing math.
- The four cards must reflow responsively from a 4-column row to a 2-column grid on narrow screens.
Want to tighten it up first? Run this prompt through the AI Prompt Studio to score it across 8 quality dimensions, catch anti-patterns, and tune the wording for Claude, ChatGPT, or Gemini before you paste it in.
Step by step
How to Use
- 1Load the snippetFour stat cards appear with their big numbers starting at 0, each immediately animating upward.
- 2Watch the count-upEach number accelerates then eases into its final value over about 1.2 seconds rather than stopping abruptly, ending exactly on 48,250, 3,184, 912, and 4.8%.
- 3Compare the trend badgesRevenue, Active Users, and Conversion Rate show a green ▲ badge with a percentage; Orders shows a red ▼ badge, color-coded automatically via Bootstrap subtle badge classes.
- 4Resize the browser narrowerThe four cards reflow from a 4-column row into a 2-column grid on small screens via Bootstrap's col-6 col-lg-3 classes.
- 5Reload the pageAll four counters restart from 0 and animate up again, since the animation runs once on script load rather than being a one-time server-rendered value.
Real-world uses
Common Use Cases
Got questions?
Frequently Asked Questions
requestAnimationFrame syncs updates to the browser's actual paint cycle, so the animation runs at the display's native refresh rate and pauses automatically when the tab is in the background, whereas a fixed setInterval can drop frames or keep firing needlessly off-screen.
Progress from 0 to 1 is transformed with 1 - Math.pow(1 - progress, 3), a standard cubic ease-out curve, so the counter moves quickly at first and slows down as it approaches the target instead of animating at a constant linear speed.
No — the step() function explicitly writes the exact data-target value (not the last eased calculation) once progress reaches 1, which avoids the common floating-point issue where eased math lands a fraction below the true target.
Yes — call the same requestAnimationFrame loop from useEffect (React) or onMounted (Vue) using a ref to the number element instead of getElementById, and cancel any in-flight animation frame in the cleanup function or ngOnDestroy if the component can unmount mid-animation.
Yes — replace the card, bg-*-subtle, and badge classes with Tailwind utility classes on the same elements; the animation logic only touches data attributes and textContent, so it is completely decoupled from the styling framework.
Copy an existing card block, change its icon, label, and data-target (plus data-prefix/data-suffix/data-decimals if needed) — no JavaScript edits are required since every element matching [data-target] is animated automatically on load.