You Might Also Like
Learn Coding Visually
Learn to code with interactive, live-preview playgrounds — HTML, CSS, JavaScript, React & more.
 HTML Playground42 lessons · Click-based · Live preview
 CSS PlaygroundLearn CSS with a live editor
 JavaScript Playground60 lessons · DOM · Async · Canvas
 React PlaygroundLearn React with a live code editor
 GSAP PlaygroundLearn GSAP animation interactively
 SVG Playground44 lessons · shapes · paths · animation
 SCSS Playground45 lessons · Sass modules · tokens
 Tailwind PlaygroundLearn Tailwind CSS with a live editor
 Bootstrap 5 Playground50 lessons · live preview
A/B Test Results Card — Free Split-Test Comparison Snippet
A/B Test Results Card · Cards · Plain HTML, CSS & JS · Live preview
What's included
Features
About this UI Snippet
A/B Test Results Card — Variant Comparison With a Real Confidence Calculation
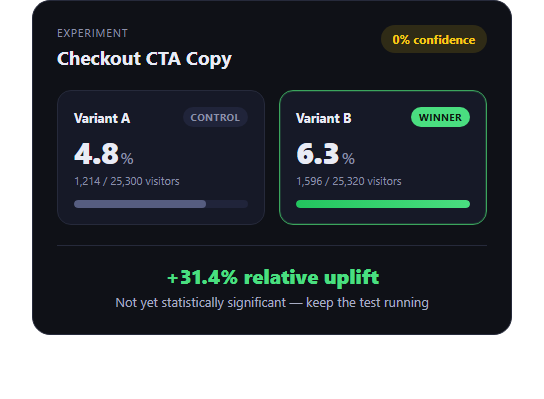
The A/B test results card is the summary widget every experimentation dashboard needs: it puts two variants side by side, shows their conversion rates and sample sizes, and declares a statistical winner. This snippet builds one in plain HTML, CSS, and JavaScript, with the confidence badge computed from a real two-proportion z-test instead of a fixed label.
A real statistical test, not a hardcoded badge
The zTestConfidence(a, b) function runs a standard two-proportion z-test against the actual conversion counts and visitor totals for each variant: it pools the conversion rate, computes the standard error, derives a z-score, and approximates a confidence percentage from it with a lightweight logistic approximation of the normal CDF. Change the input numbers and the confidence badge, uplift figure, and verdict text all recompute — nothing is a hardcoded "95%" string.
Visual comparison bars
Below each variant's headline rate, a horizontal bar scales relative to the higher of the two rates, giving an at-a-glance read of the gap before anyone reads the numbers. The winning variant's bar uses a green gradient to reinforce the declared winner.
Clear winner state
The winning variant card gets a highlighted border and a "Winner" tag, and the footer prints both the relative uplift percentage and a verdict sentence — but only declares a winner once confidence clears the 95% threshold computed from the test. Below that threshold, the card honestly reports the result isn't significant yet rather than forcing a call.
Customizing it
Swap in your real experiment's conversion and visitor counts, adjust the significance threshold, add a third variant, or wire the verdict text to your experimentation platform's API. Pair it with a funnel chart to show where in the funnel the lift occurred, or a stat comparison card for a simpler two-number comparison.
Build with AI
Build, Understand, Optimize, and Extend It With AI
Statistical significance is easy to fake with a hardcoded badge and easy to get subtly wrong with a real calculation, so it's worth having an AI coding assistant like Claude walk through this snippet's zTestConfidence() function line by line — why it pools the conversion rate across both variants before computing standard error, why the z-score gets converted through a logistic approximation rather than a true normal CDF, and where that approximation could diverge from a proper statistics library at the tails. It's also useful for hardening the UI logic: ask whether the 95% significance threshold should be configurable, whether the card should show a confidence interval rather than a point estimate, or how to handle the edge case where one variant has zero conversions. From there, have it help you wire the card to a real experimentation backend or add a minimum-sample-size gate before declaring any winner at all.
Prompt to recreate it
Copy this into your AI assistant of choice to build the effect from scratch, or as a jumping-off point for your own variant:
Build an "A/B test results card" in plain HTML, CSS, and JavaScript — no chart library, no CDN.

Requirements:
- Show two variant cards side by side (e.g. "Variant A" / control and "Variant B" / treatment), each displaying its conversion rate as a percentage, and its raw conversions-over-visitors sample size.
- Compute a real statistical significance/confidence value from the two variants' actual conversion and visitor counts using a two-proportion z-test (pooled conversion rate, standard error, z-score, and an approximation of confidence from the z-score) — do not hardcode a "95% confidence" string; it must be derived from the numbers.
- Show a horizontal bar under each variant's rate, scaled relative to the higher of the two conversion rates, for an at-a-glance visual comparison.
- Highlight the winning variant (border/tag) only once the computed confidence clears a significance threshold (e.g. 95%); below that threshold, show an honest "not yet significant" verdict instead of forcing a winner.
- Display the relative uplift percentage between the two variants, computed from their rates.
- Keep the whole thing driven by a single data object (visitors/conversions per variant) so changing the numbers updates every derived value in the card. Dark-theme friendly, no dependencies.
Want to tighten it up first? Run this prompt through the AI Prompt Studio to score it across 8 quality dimensions, catch anti-patterns, and tune the wording for Claude, ChatGPT, or Gemini before you paste it in.
Step by step
How to Use
- 1Paste HTML, CSS, and JSThe card renders with both variants and a confidence badge.
- 2Check the confidence badgeIt's computed live from the conversion counts via a z-test.
- 3Read the verdictA winner is declared only above the significance threshold.
- 4Swap in real dataEdit the data object with your experiment's actual numbers.
- 5Adjust the thresholdChange the 95 check in the JS to your team's bar for significance.
Real-world uses
Common Use Cases
Got questions?
Frequently Asked Questions
Yes. zTestConfidence() runs a two-proportion z-test using the pooled conversion rate and standard error from the actual visitor and conversion counts for both variants, then approximates a confidence percentage from the resulting z-score. It is not a hardcoded "95%" label — change the input numbers and it recomputes.
Only when the computed confidence is at or above 95%. Below that, the verdict text says the result isn't yet statistically significant, so the card won't mislead viewers into acting on a test that hasn't reached significance.
It uses a logistic approximation of the normal CDF, which is accurate enough for a UI badge but not a substitute for a dedicated statistics library in a production experimentation platform. For rigorous analysis, compute significance server-side with a proper stats package and pass the result into the card.
Edit the data.a and data.b objects (visitors and conversions) at the top of the JS. Every derived value — rates, bar widths, uplift, confidence, and the verdict — recomputes from those two objects.
Move data into component state or props, keep zTestConfidence() and rate() as pure helper functions, and drive the bar widths and verdict text from computed values in your template instead of direct DOM writes.