You Might Also Like
Learn Coding Visually
Learn to code with interactive, live-preview playgrounds — HTML, CSS, JavaScript, React & more.
 HTML Playground42 lessons · Click-based · Live preview
 CSS PlaygroundLearn CSS with a live editor
 JavaScript Playground60 lessons · DOM · Async · Canvas
 React PlaygroundLearn React with a live code editor
 GSAP PlaygroundLearn GSAP animation interactively
 SVG Playground44 lessons · shapes · paths · animation
 SCSS Playground45 lessons · Sass modules · tokens
 Tailwind PlaygroundLearn Tailwind CSS with a live editor
 Bootstrap 5 Playground50 lessons · live preview
UV Index Meter — Free WHO/EPA UV Index Scale Widget
UV Index Meter · Charts · Plain HTML, CSS & JS · Live preview
What's included
Features
About this UI Snippet
UV Index Meter — Real WHO/EPA Bands With Per-Level Sun-Safety Advice
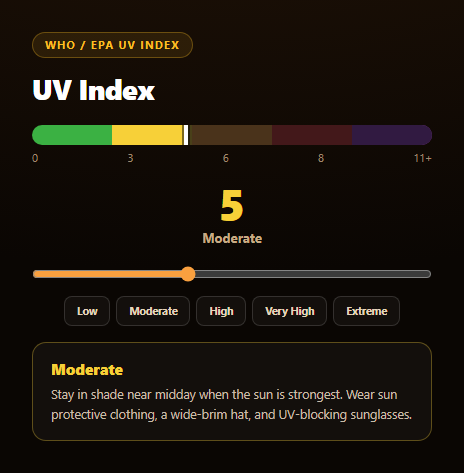
This meter reproduces the actual UV Index scale published by the World Health Organization and used in the US EPA's UV Index reporting — the same five categories, boundaries, and colors you'd see on a weather app's UV forecast — not an arbitrary gradient.
The real UV Index bands
The BANDS array encodes the WHO/EPA scale exactly: Low (0-2, green #3bb143), Moderate (3-5, yellow #f7d038), High (6-7, orange #f9a03f), Very High (8-10, red #e0433a), and Extreme (11+, purple #a34ac4). bandFor(uv) returns the first band whose max the value doesn't exceed, the same lookup pattern a real weather app's UV display uses, driven here by a slider capped for display purposes at 13.
A masked-fill meter, not a bar chart
The track is five fixed colored segments sized to match the real band ranges, permanently visible end to end — the "meter" effect comes from uvi-fill, a dark overlay anchored to the right edge whose width shrinks as the UV value rises, progressively revealing more of the colored scale from the left. A separate uvi-marker tick slides along the track via a left percentage to point at the exact current value, both animated with the same spring-like easing so the meter feels responsive without looking like a plain progress bar.
Sun-safety advice per band, not just a color
Each band carries real short-form WHO/EPA guidance — from "minimal danger" and optional sunglasses at Low, through mandatory shade and reapplied SPF 30+ at High and Very High, to "unprotected skin can burn in minutes" at Extreme — so the number on screen comes with the actual action it implies. Pair this with an air quality index gauge or weather widget for a full outdoor-conditions dashboard.
Build with AI
Build, Understand, Optimize, and Extend It With AI
Paste this snippet's HTML, CSS, and JS into an AI coding assistant like Claude and ask it to verify the UV Index breakpoints and colors against the WHO Global Solar UV Index guide, and to explain how the "masked fill" meter effect works — specifically why a dark overlay anchored to the right edge with a shrinking width, combined with a separately positioned marker tick, can simulate a filling gauge without canvas or SVG. It's also useful for reasoning about display range — ask why the scale is capped at a fixed maximum for display purposes even though real UV Index readings can technically exceed it, and what the tradeoffs are of raising or lowering that cap. For extensions, ask it to wire the meter up to a real weather API's UV forecast field with periodic polling, add an hourly forecast strip showing how UV Index changes across the day, or add a "time to burn" estimate based on skin type and current UV value. Treat the code less like a finished artifact and more like a starting point for a conversation.
Prompt to recreate it
Copy this into your AI assistant of choice to build the effect from scratch, or as a jumping-off point for your own variant:
Build a "UV Index meter" in plain HTML, CSS, and JavaScript (no canvas, no charting library) using the real WHO/EPA UV Index scale.

Requirements:
- Use the actual WHO/EPA UV Index breakpoints and standard colors: Low 0-2 (green), Moderate 3-5 (yellow), High 6-7 (orange), Very High 8-10 (red), Extreme 11+ (purple). Get these boundaries and colors exactly right — do not invent different thresholds.
- Render a horizontal meter as five fixed-width colored track segments (one per band, sized proportionally to that band's real range within a display scale capped around 13), always fully visible. Layer a dark overlay div anchored to the track's right edge whose width shrinks as the current UV value increases, progressively revealing the colored scale from the left to create a "filling meter" effect — plus a separate thin marker/tick element positioned with a left percentage to point at the exact current value. Animate both with a smooth transition.
- A range slider (0 to the display cap) that updates the UV value live as it's dragged, plus a row of preset buttons that jump directly to a representative value within each of the five bands.
- A large numeric UV readout (supporting one decimal place for non-integer preset values) and a text label showing the current band name, both colored to match the active band, plus a short sun-safety advice paragraph beneath the meter that changes to that band's real WHO/EPA-style guidance (e.g. optional sunglasses at Low, up through "unprotected skin can burn in minutes" at Extreme).
- Structure the code so a single function (e.g. update(uvValue)) is the one place that looks up the correct band from a UV value and updates the marker position, fill width, readout color, band label, and advice text — so the same function could later be driven by a live weather API instead of the slider.
Want to tighten it up first? Run this prompt through the AI Prompt Studio to score it across 8 quality dimensions, catch anti-patterns, and tune the wording for Claude, ChatGPT, or Gemini before you paste it in.
Step by step
How to Use
- 1Paste HTML, CSS, and JSThe meter renders at UV 5 — Moderate.
- 2Drag the sliderThe marker and dark mask move live across the real band track.
- 3Click a presetJump to a representative value in each of the five bands.
- 4Read the adviceSun-safety guidance updates to match the real WHO/EPA band.
- 5Cross the 2/5/7/10 marksWatch the label and color change exactly at real breakpoints.
- 6Wire up live dataCall update(uv) from a weather API's UV forecast field.
Real-world uses
Common Use Cases
Got questions?
Frequently Asked Questions
Yes. The BANDS table matches the World Health Organization's Global Solar UV Index scale, also used in US EPA UV Index reporting: Low 0-2, Moderate 3-5, High 6-7, Very High 8-10, and Extreme 11 and above, with the standard green/yellow/orange/red/purple color coding used across weather services worldwide.
The UV Index scale is technically open-ended (readings near the equator at high altitude can exceed 13), but most consumer weather displays cap the visual scale around 11-13 for readability, since anything in that range already falls in the Extreme band and calls for the same maximum precautions. The UV_MAX_SCALE constant controls this cap and can be raised if you need to display higher real-world readings.
The track is five fixed colored segments, always fully visible end to end and sized to the real band ranges. A dark overlay (uvi-fill) is anchored to the track's right edge and its width shrinks as the UV value increases, progressively uncovering more of the colored scale from the left — combined with a separate marker tick positioned by a left percentage to point at the exact value, this reads as a filling meter without needing a canvas or SVG gradient.
Yes — the slider and preset buttons both just call the same update(uv) function, which clamps the value, looks up the correct band, and updates the marker position, fill width, readout, and advice text. Call update(currentUvFromYourWeatherApi) on whatever refresh interval your data source provides, and hide the slider/presets if manual control isn't needed.
Keep the numeric UV value in component state, derive the active band with the same breakpoint lookup, and bind the marker's left position, the fill's width, the readout color, and the advice text to that derived band — the five colored track segments are static markup that never needs to re-render.