You Might Also Like
Learn Coding Visually
Learn to code with interactive, live-preview playgrounds — HTML, CSS, JavaScript, React & more.
 HTML Playground42 lessons · Click-based · Live preview
 CSS PlaygroundLearn CSS with a live editor
 JavaScript Playground60 lessons · DOM · Async · Canvas
 React PlaygroundLearn React with a live code editor
 GSAP PlaygroundLearn GSAP animation interactively
 SVG Playground44 lessons · shapes · paths · animation
 SCSS Playground45 lessons · Sass modules · tokens
 Tailwind PlaygroundLearn Tailwind CSS with a live editor
 Bootstrap 5 Playground50 lessons · live preview
Sleep Cycle Chart — Free HTML CSS JS Snippet
Sleep Cycle Chart · Charts · Plain HTML, CSS & JS · Live preview
What's included
Features
About this UI Snippet
Sleep Cycle Chart — Stacked Sleep-Stage Timeline in Pure SVG
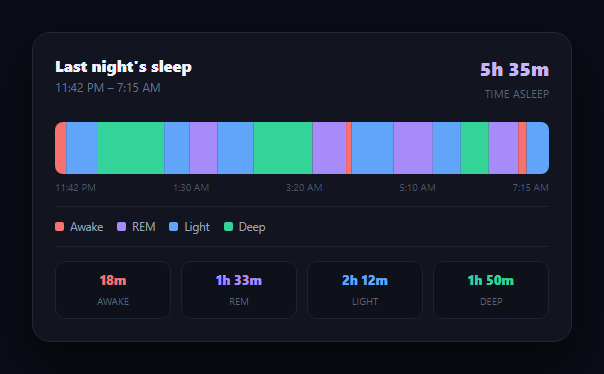
Sleep-tracking apps summarize a night in one recognizable shape: a horizontal bar segmented by stage — awake, REM, light, deep — that lets you see the night's rhythm at a glance without reading a single number. This snippet rebuilds that chart with plain SVG rectangles and CSS, no charting library, alongside a color legend and per-stage duration stats. It pairs well with a water intake tracker or workout interval timer in a broader health dashboard.
Segments, not a data series
Sleep data here is a chronological array of { stage, minutes } segments rather than one value per hour — because real sleep cycles don't move in neat hourly buckets, they shift between stages every 10-50 minutes throughout the night. Modeling it as ordered segments captures that texture accurately: cycling from light to deep to REM and back, with occasional brief awakenings, several times per night.
One SVG, proportional rectangles
render() walks the segment array once, computing each rectangle's width as its share of the total sleep-tracking duration scaled to the SVG's viewBox width, and advancing an x cursor as it goes. Because preserveAspectRatio="none" is set on the <svg>, the chart stretches to fill any container width while each segment's *relative* width — and therefore the story it tells about the night — stays exactly proportional.
Color coding that matches sleep-tracker conventions
Awake is red (a state to minimize), deep sleep is green (the most restorative stage), REM is purple, and light sleep is blue — following the color language used by Apple Health, Fitbit, and Oura, so the chart reads instantly to anyone who has seen a sleep-tracking app before. The legend and the per-stage summary stats reuse the exact same color-per-stage object as the chart bars, so there's a single place to change a stage's color.
Totals computed from the same segments
The header's "time asleep" figure and the four per-stage summary cards at the bottom are both derived by summing the same SEGMENTS array the chart bars are drawn from — awake minutes are subtracted from the total for "time asleep," and each stage's minutes are summed independently for its stat card. Nothing is hand-entered separately, so the chart and the numbers beneath it can never disagree.
Feeding it real tracker data
Replace SEGMENTS with the stage-change events exported by a wearable's API or health-data export (Apple HealthKit, Fitbit, Oura, Google Fit typically expose exactly this shape: a stage label plus a start/end or duration) and call render() once on load. The axis labels under the chart should also be computed from the actual sleep start/end time rather than hard-coded, if you're wiring in live data.
Build with AI
Build, Understand, Optimize, and Extend It With AI
You don't have to work out the proportional-SVG math by hand. Paste this snippet's HTML, CSS, and JS into an AI coding assistant like Claude and ask it to explain exactly how each segment's rectangle width is calculated from its share of the total duration and the SVG viewBox, and why preserveAspectRatio="none" is what lets the chart stretch to any container width while keeping segment proportions accurate. The same assistant can help you optimize it — ask whether building one string of SVG markup per render is efficient enough for a chart that might update live, or whether it should instead patch individual rect widths. It's also useful for extending the chart: ask it to add a hover tooltip showing the exact time range of each segment, stack multiple nights vertically for a weekly trend view, or compute the axis time labels dynamically from a real sleep start and end timestamp instead of hard-coded strings. Treat the code less like a finished artifact and more like a starting point for a conversation.
Prompt to recreate it
Copy this into your AI assistant of choice to build the effect from scratch, or as a jumping-off point for your own variant:
Build a "sleep cycle chart" in plain HTML, CSS, and JavaScript using pure SVG — no charting library, no canvas, no frameworks.

Requirements:
- Model a night's sleep as a chronologically ordered array of segments, each with a sleep stage (Awake, REM, Light, or Deep) and a duration in minutes — not one fixed value per hour, since real sleep stages change irregularly throughout the night.
- Render the segments as a single horizontal stacked bar using SVG rectangles placed edge to edge, where each rectangle's width is proportional to that segment's share of the total tracked duration, all drawn inside one <svg> with a fixed internal viewBox so proportions stay mathematically exact regardless of the SVG's rendered pixel size.
- Make the chart's rendered width fluid (it should stretch to fill its container) while every segment's relative width stays accurate — this requires disabling the SVG's default aspect-ratio-preserving scaling behavior.
- Give each of the four sleep stages a distinct, semantically appropriate color (e.g. a color that reads as "alert/red" for Awake and a color that reads as "restful/green" for Deep sleep), and drive the chart bars, a legend below the chart, and any per-stage summary stats entirely from one shared color/label lookup object, so there is only one place to change a stage's color.
- Below the chart, show a small legend mapping each color to its stage label, and a set of summary stat cards (one per stage) showing the total time spent in that stage, computed by summing the segment durations for that stage — computed from the same segment data the chart bars are drawn from, not entered or maintained separately.
- Show a readable total "time asleep" figure (total tracked time minus awake time) formatted as hours and minutes (e.g. "7h 33m"), not raw minutes.
Want to tighten it up first? Run this prompt through the AI Prompt Studio to score it across 8 quality dimensions, catch anti-patterns, and tune the wording for Claude, ChatGPT, or Gemini before you paste it in.
Step by step
How to Use
- 1Paste HTML, CSS, and JSA stacked sleep-stage bar renders for a sample night with the legend and stats beneath it.
- 2Read the timelineColored segments run left to right in chronological order from lights-out to wake.
- 3Check the legendFour swatches map red/purple/blue/green to Awake/REM/Light/Deep.
- 4Check the summary cardsEach card totals that stage's minutes summed across every segment in the night.
- 5Resize the containerThe chart stretches to fill any width while segment proportions stay accurate.
- 6Feed in real dataReplace SEGMENTS with stage-change data exported from a wearable or health API.
Real-world uses
Common Use Cases
Got questions?
Frequently Asked Questions
Real sleep doesn't move through stages on a clean hourly schedule — a person cycles between light, deep, and REM sleep every 10 to 50 minutes or so throughout the night, with brief awakenings scattered in between. An ordered array of { stage, minutes } segments captures that irregular rhythm accurately, whereas an hourly bucket would flatten and misrepresent short stage changes.
The SVG's viewBox is a fixed internal coordinate system (600 wide), and each segment's rectangle width is calculated as its share of the total duration scaled into that 600-unit space. Setting preserveAspectRatio="none" tells the browser to stretch the SVG's rendered width to fill its container without preserving the viewBox's aspect ratio, so segment proportions (not absolute pixel widths) are what stay accurate as the chart resizes.
These follow the color conventions used by mainstream sleep trackers (Apple Health, Fitbit, Oura): red typically flags awake time as a state to minimize, green marks deep sleep as the most restorative stage, purple represents REM, and blue represents light sleep. Matching this convention means the chart is instantly legible to anyone who has used a sleep-tracking app before.
Both the chart bars and the summary cards are derived from the exact same SEGMENTS array in a single render() pass — the function accumulates each stage's total minutes into a byStage object as it draws the bars, then uses that same object to populate the stat cards. There's no separately maintained total, so the two views can never disagree.
Most sleep-tracking platforms (Apple HealthKit, Fitbit Web API, Oura, Google Fit) expose sleep data as a series of stage-change events with a stage label and a start/end time or duration. Map that response into the { stage, minutes } segment shape this snippet expects, replace the hard-coded SEGMENTS array and the hard-coded axis time labels with values derived from the real sleep start/end time, and call render().