You Might Also Like
Learn Coding Visually
Learn to code with interactive, live-preview playgrounds — HTML, CSS, JavaScript, React & more.
 HTML Playground42 lessons · Click-based · Live preview
 CSS PlaygroundLearn CSS with a live editor
 JavaScript Playground60 lessons · DOM · Async · Canvas
 React PlaygroundLearn React with a live code editor
 GSAP PlaygroundLearn GSAP animation interactively
 SVG Playground44 lessons · shapes · paths · animation
 SCSS Playground45 lessons · Sass modules · tokens
 Tailwind PlaygroundLearn Tailwind CSS with a live editor
 Bootstrap 5 Playground50 lessons · live preview
requestAnimationFrame FPS Meter & Easing Visualizer
requestAnimationFrame FPS Meter & Easing Visualizer · Dashboards · Plain HTML, CSS & JS · Live preview
What's included
Features
About this UI Snippet
requestAnimationFrame FPS Measurement and Easing Function Visualization Explained
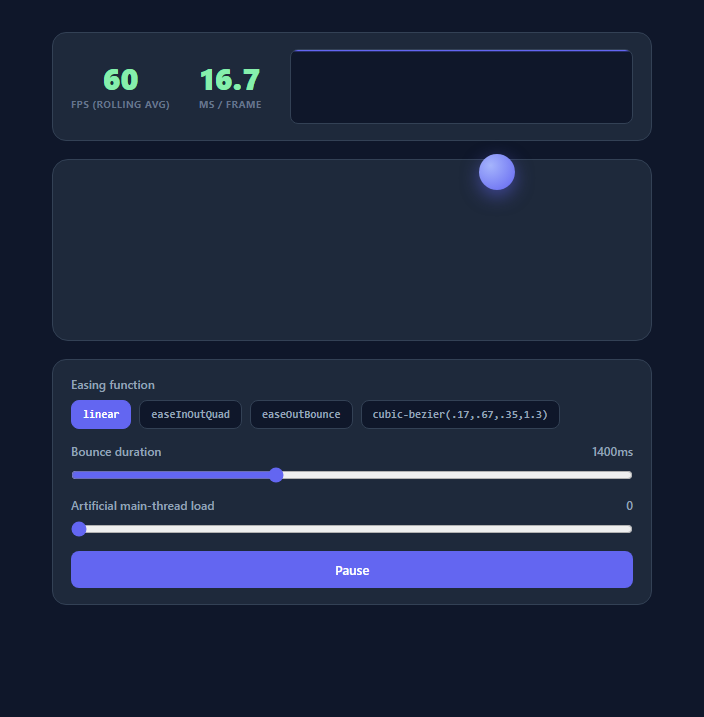
Smooth animation on the web is a function of two independent things: how consistently the browser can paint new frames (frame rate), and how the value being animated changes over time (the easing curve). This snippet builds a real, working instrument for both — a genuine requestAnimationFrame-based FPS meter that measures actual frame-to-frame timing, paired with a bouncing ball whose motion is driven by selectable easing functions, so you can watch how easing shapes perceived motion while simultaneously monitoring whether the browser is actually hitting your target frame rate.
How requestAnimationFrame timing actually works
requestAnimationFrame(callback) schedules callback to run once, right before the browser's next repaint, and passes it a single argument: a high-resolution timestamp (in milliseconds, from the same clock as performance.now()) representing when that frame's paint cycle began. Critically, the browser does not guarantee a fixed interval between calls — it targets the display's refresh rate (typically 60Hz, but 90/120/144Hz on modern displays and variable-refresh setups), and it will skip frames entirely if the main thread is busy. This demo's loop(now) function captures that timestamp, computes delta = now - lastTime — the actual milliseconds elapsed since the previous frame — and that delta, not any fixed assumption, is the raw signal every FPS meter must be built from.
From frame delta to a stable FPS number
A single frame's instantaneous FPS (1000 / delta) is far too noisy to display directly — one slightly delayed frame would make the number jump wildly. This demo keeps a rolling window of the last 30 frame deltas in the frameSamples array, averages them, and only then converts to FPS: 1000 / avgDelta. This rolling-average technique is the same smoothing approach used by real browser DevTools performance panels and game engine debug overlays, and it's what makes the displayed number in this demo (and the <canvas>-drawn history graph beneath it) readable rather than flickering unusably between frames.
Using artificial load to see FPS actually drop
To make the meter's purpose concrete, this demo includes a "main-thread load" slider that runs a deliberately wasteful synchronous loop (burnCpu(), summing square roots for N iterations) inside the animation loop itself. Because requestAnimationFrame callbacks run on the main thread and block the next paint until they return, adding CPU work here directly delays subsequent frames — dragging the slider up is the fastest way to watch the FPS number and graph genuinely degrade from 60 toward 30 or lower in real time, demonstrating exactly why long synchronous JavaScript tasks are the primary cause of janky animation in real applications.
Easing functions: shaping progress, not position
An easing function is a pure mathematical mapping from linear time progress t (0 to 1) to eased progress (also typically 0 to 1, though bounce/back easings can briefly exceed that range). This demo implements four: linear (t => t, constant velocity — the "obviously not human-designed" baseline), easeInOutQuad (a quadratic curve that starts and ends slow, speeds up through the middle — the standard curve for most UI micro-interactions), easeOutBounce (a piecewise function simulating physical bounce decay, useful for playful confirmation animations), and a JS approximation of a cubic-bezier(.17,.67,.35,1.3) curve — the same control-point model CSS's cubic-bezier() timing function uses, here approximated by directly weighting the bezier control points against t rather than solving the parametric x(t) inversion a true bezier requires, which keeps the math approachable while still visibly demonstrating an overshoot curve.
Why frame timing and easing choice are linked in practice
An aggressive bounce or overshoot easing amplifies the visual cost of dropped frames — a linear animation missing a frame is barely perceptible, but a bounce animation missing frames near its peak velocity reads as an obvious stutter. This is precisely why this demo puts the FPS meter and the easing selector in the same view: understanding animation performance requires seeing both signals together, exactly as a developer profiling real jank in a production animation would.
Build with AI
Build, Understand, Optimize, and Extend It With AI
Paste this snippet into an AI coding assistant like Claude and ask it to explain step by step how frameSamples and avgDelta turn a single noisy frame timestamp into the smooth FPS number on screen — understanding that rolling-average pattern is broadly reusable any time you need to measure real-time performance in the browser. You could also ask it to add a fifth easing function of your choosing (perhaps an elastic or back-out curve) following the same t-in-t-out signature as the existing EASINGS object, or to replace the burnCpu() artificial load simulation with a more realistic one (like forcing synchronous layout thrashing via repeated element.offsetHeight reads) to compare which kinds of main-thread work hurt frame rate the most. It's also a good target for a code-quality pass — ask whether the cubicBezier approximation should be replaced with a proper Newton-Raphson x(t) solve to match real CSS cubic-bezier() behavior more precisely.
Prompt to recreate it
Copy this into your AI assistant of choice to build the effect from scratch, or as a jumping-off point for your own variant:
Build a live requestAnimationFrame FPS meter combined with a selectable easing-function visualizer in plain HTML, CSS, and JavaScript — no libraries.

Requirements:
- A requestAnimationFrame-driven loop that reads the timestamp argument passed to its callback each frame, computes the delta versus the previous frame's timestamp, and maintains a rolling window (e.g. the last 30 samples) that gets averaged into a displayed FPS number and a ms-per-frame number, both using real measured timing rather than any hardcoded assumption.
- A small canvas-based line graph plotting recent FPS history (roughly the last 60 samples) with a reference line at 60fps, redrawn every frame from the same rolling data used for the numeric readout.
- A ball or box that bounces back and forth across a track, with its position each frame computed from an eased progress value (0 to 1) rather than a CSS transition, so the position calculation is visible and controllable in JavaScript.
- At least three distinct, hand-written JavaScript easing functions (for example linear, an ease-in-out quadratic, and a piecewise bounce-decay function) selectable via buttons, all sharing the same t-in-progress-out function signature so swapping them is a one-line change in the animation loop.
- A slider that introduces deliberate, measurable main-thread load (a real synchronous CPU-bound loop, not a fake delay) inside the animation loop, so increasing it visibly and genuinely degrades the displayed FPS rather than just being decorative.
- A Pause/Resume control that fully stops calling requestAnimationFrame when paused, and correctly resets the delta-timing baseline on resume so the first frame after resuming doesn't register a huge artificial delta.
- Color-code the FPS readout (e.g. green above 50fps, amber above 30fps, red below) so frame-rate health is readable at a glance without reading the exact number.
Want to tighten it up first? Run this prompt through the AI Prompt Studio to score it across 8 quality dimensions, catch anti-patterns, and tune the wording for Claude, ChatGPT, or Gemini before you paste it in.
Step by step
How to Use
- 1Watch the FPS number and graphThe large green number is a 30-frame rolling average FPS computed from real requestAnimationFrame timestamp deltas, and the canvas beneath it plots the last 60 samples as a line graph with a reference line at 60fps, so you can see stability, not just a single instantaneous number.
- 2Switch easing functionsClick linear, easeInOutQuad, easeOutBounce, or the cubic-bezier button to change which EASINGS function drives the ball's horizontal progress calculation in animateBounce(). Compare how the same bounce duration feels dramatically different depending purely on the eased-progress curve.
- 3Adjust the bounce durationThe duration slider sets the half-cycle duration in milliseconds used inside animateBounce() — the ball travels forward across this duration, then reverses using the same easing for the return trip, so a full round trip takes 2x the slider value.
- 4Crank up the artificial load sliderDrag "Artificial main-thread load" above 0 to make burnCpu() run a wasteful synchronous loop inside every animation frame. Watch the FPS number and graph genuinely drop as this loop delays the next requestAnimationFrame callback — this is a live demonstration of main-thread blocking causing dropped frames, not a simulated number.
- 5Pause and resume the loopClick Pause to stop calling requestAnimationFrame entirely (running = false short-circuits the loop function), freezing both the FPS meter and the ball. Click Resume to reset lastTime to the current timestamp before restarting, avoiding one artificially huge delta from the paused gap.
- 6Export and adapt the FPS meterClick JSX or Vue to export. The rolling-average FPS pattern (loop, frameSamples array, avgDelta calculation) is directly reusable as a standalone performance overlay in any project — wrap the loop() function in a React useEffect with a cleanup that cancels the animation frame on unmount.
Real-world uses
Common Use Cases
Got questions?
Frequently Asked Questions
A single frame's instantaneous FPS (1000 / delta for that one frame) is extremely noisy — one frame delayed by even a few milliseconds by garbage collection, layout, or a background tab throttle produces a wildly different momentary number. This demo averages the last 30 frame deltas before converting to FPS, which is why the displayed number and graph are smooth and readable; always average several samples before displaying a live FPS metric in your own tools.
The burnCpu() function runs a real, synchronous, CPU-bound loop (summing square roots for tens of thousands of iterations) directly inside the requestAnimationFrame callback. Because JavaScript is single-threaded and the browser cannot paint the next frame until the current callback returns, this loop directly delays every subsequent frame by however long it takes to execute — the FPS drop you see is a genuine measurement of main-thread blocking, not a simulated or faked value.
The CSS keywords ease, ease-in, ease-in-out, and linear are themselves predefined cubic-bezier() curves under the hood. This demo's linear and easeInOutQuad are hand-written JS equivalents of similar shapes, while its cubicBezier function approximates an actual four-control-point bezier curve (matching the same x1,y1,x2,y2 parameter model CSS cubic-bezier() takes) by directly weighting progress against the y-control-points, which is simpler than a true bezier x(t) solve but visually demonstrates the same overshoot behavior.
No — requestAnimationFrame targets the display's actual refresh rate, which can be 60Hz, 90Hz, 120Hz, or 144Hz on modern hardware, and it is throttled or entirely paused when a tab is backgrounded or a device is in low-power mode. This is exactly why frame timing must be measured from the timestamp argument passed to your callback rather than assumed — this demo's FPS number will genuinely read higher than 60 on a 120Hz+ display with light load, which is correct, real behavior.
For simple, non-interactive motion, a CSS animation (or the Web Animations API) is usually preferable since it can run on the compositor thread and is less likely to be blocked by main-thread JavaScript. Reach for a hand-rolled requestAnimationFrame loop, as this demo does, when you need per-frame custom easing math, need to read live position for hit-testing or physics, or specifically want to visualize and measure frame timing yourself as part of a debugging or educational tool.