You Might Also Like
Learn Coding Visually
Learn to code with interactive, live-preview playgrounds — HTML, CSS, JavaScript, React & more.
 HTML Playground42 lessons · Click-based · Live preview
 CSS PlaygroundLearn CSS with a live editor
 JavaScript Playground60 lessons · DOM · Async · Canvas
 React PlaygroundLearn React with a live code editor
 GSAP PlaygroundLearn GSAP animation interactively
 SVG Playground44 lessons · shapes · paths · animation
 SCSS Playground45 lessons · Sass modules · tokens
 Tailwind PlaygroundLearn Tailwind CSS with a live editor
 Bootstrap 5 Playground50 lessons · live preview
WebSocket vs Polling Visualizer — Free HTML CSS JS Snippet
WebSocket vs Polling Visualizer · Dashboards · Plain HTML, CSS & JS · Live preview
What's included
Features
About this UI Snippet
WebSocket vs Polling Visualizer — Animated Round-Trip Timer vs Persistent Push Connection in Vanilla JS
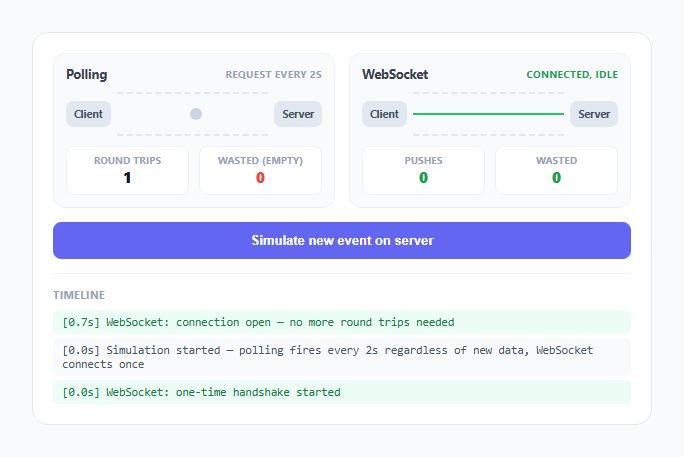
"WebSockets are more efficient than polling" is a sentence almost every frontend developer has repeated without necessarily having watched the two approaches run side by side long enough to see why. This snippet runs both simultaneously, on the same clock, so the difference in wasted round trips and delivery latency is something you count rather than something you take on faith.
Polling: a real fixed-interval loop, not a one-off animation
The left panel runs startPolling(), which fires an initial runPollCycle() immediately and then repeats it every POLL_INTERVAL (2000ms) using a genuine setInterval — this is not a scripted five-step animation, it keeps running for as long as the page is open, exactly like a real polling client would. Each cycle spawns a request packet that animates from the Client node to the Server node over 700ms using a CSS keyframe animation (travelRight), and the moment it "arrives," a response packet animates back (travelLeft). Whether that response carries new data is decided by Math.random() < 0.28 — a roughly 28% chance per poll — which mimics the real-world situation of polling for updates that do not arrive on every single check.
Why most polling round trips are wasted, made countable
Every completed poll cycle increments the Round Trips counter unconditionally, but only the cycles where hasNewData was false increment the separate Wasted counter, rendered in the response packet as a dim grey dot instead of a green one. Over any reasonably long run, the Wasted count climbs steadily even while nothing meaningful is happening on the server — because the fixed-interval loop has no way to know whether new data exists without asking, so it has to ask on a timer regardless. This is the concrete, countable version of the standard "polling wastes bandwidth and server load on empty checks" claim: watch the Wasted number and the Round Trips number converge toward the same value during a quiet period, meaning nearly every request in that stretch accomplished nothing.
WebSocket: one handshake, animated once, never repeated
The right panel's connectWebSocket() runs exactly once on load. It animates a single green line growing across the client-server track over 600ms — representing the one-time HTTP Upgrade handshake that turns a normal HTTP connection into a persistent WebSocket connection — and then sets wsConnected = true. After that, no more connection-establishing work happens for the rest of the session; the panel tag switches to "connected, idle" and stays that way until an event fires. There is no interval running in the WebSocket panel at all, which is the structural point: a persistent connection means the client is not periodically doing anything just to check in.
Server push: latency measured against polling's worst case, not its best
Clicking "Simulate new event on server" calls simulateServerEvent(), which spawns a single green push packet that travels directly from Server to Client over 700ms with no preceding request packet — the server-initiated push has no round trip to complete, only a one-way delivery. Compare this to polling's worst case: if new data becomes available the instant after a poll just checked and found nothing, that update sits undelivered for up to the full 2000ms interval before the next poll happens to catch it. The WebSocket push in this snippet always delivers within one packet's travel time regardless of when the underlying event occurred, because there is no polling clock gating when the client finds out.
Reading the two Wasted counters together
The WebSocket panel's Wasted stat stays at zero for the entire simulation, and it is not decorative — there is genuinely no code path in simulateServerEvent() or connectWebSocket() that can produce an empty round trip, because the architecture has no round trips at all after the initial handshake. Placed next to polling's climbing Wasted counter over the same simulated time period, the two numbers make the efficiency argument concrete: polling pays a fixed cost on a timer whether or not it has anything to report, while a WebSocket pays a one-time connection cost and then only moves data when there is actually data to move.
Build with AI
Build, Understand, Optimize, and Extend It With AI
Give this snippet's JavaScript to an AI assistant like Claude and ask it to explain exactly why the WebSocket panel's Wasted counter can never increment given the current code paths, or to estimate how the Wasted-versus-Round-Trips ratio would change if the random new-data chance were raised or lowered. Worth asking for as extensions: Server-Sent Events as a third comparison lane, an adjustable polling interval slider to watch the wasted-trip rate change live, or a running bandwidth-estimate stat that multiplies round trips by an assumed payload size for both approaches.
Prompt to recreate it
Copy this into your AI assistant of choice to build the effect from scratch, or as a jumping-off point for your own variant:
Build a side-by-side animated comparison of polling versus WebSocket updates in plain HTML, CSS, and JavaScript, no libraries or frameworks.

Requirements:
- A "Polling" panel with a Client node and a Server node connected by a track. Run a real setInterval loop (e.g. every 2 seconds) that animates a request packet traveling client-to-server and then a response packet traveling back, for as long as the page stays open, not a fixed one-time sequence.
- Make the response packet's outcome random on each cycle (e.g. roughly a quarter of the time it carries genuinely new data, rendered in a distinct color; the rest of the time it is empty, rendered as a dimmer/grey packet), to model realistic polling for infrequent updates.
- A "WebSocket" panel with the same Client/Server node layout, where a one-time handshake animation plays once on load (a line or pulse growing across the track), after which the connection is marked open and no further connection-establishing animation ever repeats.
- A "Simulate new event on server" button that, once the WebSocket is connected, sends a single packet animating directly from Server to Client with no preceding request packet, representing a true one-way push with no round trip.
- Track and display, for both panels independently, a running count of total round trips (polling side) or pushes (WebSocket side), and a separate running count of "wasted" round trips that carried no new data, so the two approaches can be compared as concrete numbers over the same simulated time period, not just visually.
- Use CSS keyframe animations for packet travel along each track, and real setInterval/setTimeout timing (not a manually stepped fake clock) so the comparison reflects genuine elapsed time.
Want to tighten it up first? Run this prompt through the AI Prompt Studio to score it across 8 quality dimensions, catch anti-patterns, and tune the wording for Claude, ChatGPT, or Gemini before you paste it in.
Step by step
How to Use
- 1Watch both panels start at the same momentPolling begins firing a request-response cycle every 2 seconds immediately; the WebSocket panel animates a single green handshake line growing across its track.
- 2Watch the polling packets travel back and forthAn indigo request dot travels client-to-server, then a response dot travels back — grey if it carried nothing new, green if it happened to carry data, roughly 28% of the time.
- 3Watch the WebSocket panel settle into "connected, idle"Once the handshake animation finishes, the tag turns green and the Simulate button becomes enabled — no further packets travel until you trigger one.
- 4Click "Simulate new event on server" a few timesEach click sends a single green packet directly from Server to Client with no preceding request — there is no round trip, just a one-way push that arrives in one packet's travel time.
- 5Compare the Round Trips and Wasted counters on the polling sideOver a quiet stretch with no real updates, most or all polling cycles land in the Wasted column even though the Round Trips counter keeps climbing on its fixed 2-second timer regardless.
- 6Compare both panels' Wasted stats side by sidePolling's Wasted count keeps rising over time; WebSocket's Wasted count stays at zero for the entire simulation, because a push only ever happens when you explicitly trigger a real event.
Real-world uses
Common Use Cases
Got questions?
Frequently Asked Questions
Yes, with careful cleanup. The polling loop's setInterval must be started in a lifecycle hook and cleared on unmount: in React, start it in a useEffect and return a cleanup function calling clearInterval; in Vue, start it in onMounted and clear it in onUnmounted; in Angular, start it in ngOnInit and clear it in ngOnDestroy. The WebSocket panel's one-time handshake setTimeout should also be tracked and cleared the same way in case the component unmounts mid-handshake. Because packet travel is driven by CSS keyframe animations rather than a JS animation loop, there is no requestAnimationFrame loop to cancel — only the setInterval and any pending setTimeout calls need cleanup.
A polling client has no way to know whether new data exists without asking, so it has to ask on a fixed schedule regardless of whether anything actually changed since the last check. In this snippet, roughly 72% of poll cycles find nothing new, and each of those still costs a full request-response round trip, network overhead, and server processing — the Wasted counter tracks exactly that fraction directly, and it climbs regardless of how short you make the interval, only the total round trip count changes.
A real WebSocket push still takes some network time to arrive — it is not literally instantaneous — but it has no round trip to complete and no polling interval gating when the client finds out, so its latency is bounded by network transit time alone, typically milliseconds. This snippet's 700ms push animation represents that one-way transit visually; the meaningful contrast is not "zero versus nonzero" but "bounded only by network speed" versus "bounded by up to a full polling interval," which can be seconds.
Polling is simpler to implement, works through any standard HTTP infrastructure without special server support, and is perfectly reasonable when updates are infrequent, some delay is acceptable, or the number of concurrent clients is small enough that the wasted-request overhead does not matter. A persistent WebSocket connection has its own cost — the server must hold open a connection per client — which does not scale for free either; this snippet demonstrates the request-efficiency trade-off, not a blanket claim that WebSockets are free.
Keeping a Wasted counter on both panels, even though the WebSocket one never increments, makes the comparison symmetric and lets the zero speak for itself directly next to polling's climbing number, rather than asking the reader to notice an absence. It is the same stat measured the same way on both sides of the same simulated time period.