You Might Also Like
Learn Coding Visually
Learn to code with interactive, live-preview playgrounds — HTML, CSS, JavaScript, React & more.
 HTML Playground42 lessons · Click-based · Live preview
 CSS PlaygroundLearn CSS with a live editor
 JavaScript Playground60 lessons · DOM · Async · Canvas
 React PlaygroundLearn React with a live code editor
 GSAP PlaygroundLearn GSAP animation interactively
 SVG Playground44 lessons · shapes · paths · animation
 SCSS Playground45 lessons · Sass modules · tokens
 Tailwind PlaygroundLearn Tailwind CSS with a live editor
 Bootstrap 5 Playground50 lessons · live preview
Cost Per User Breakdown — Free HTML CSS JS Snippet, Real Tiered Rates
Cost Per User Breakdown · Pricing · Plain HTML, CSS & JS · Live preview
What's included
Features
About this UI Snippet
Cost Per User Breakdown — A Real Tiered Rate Table, Not a Flat Multiply
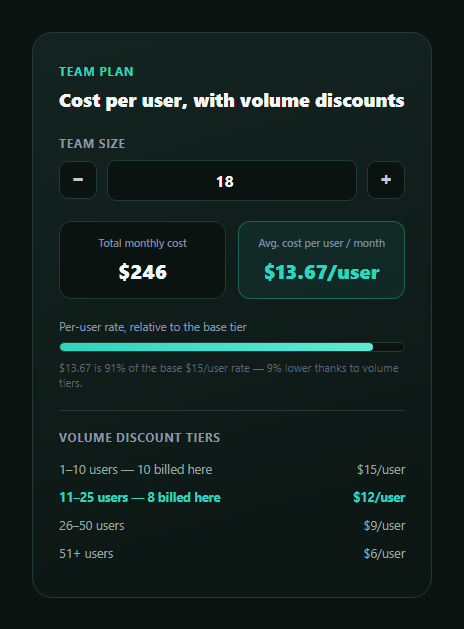
Volume discounts on per-seat pricing are usually described in a sentence ("bigger teams get a better rate") without showing the actual mechanics. This snippet implements a genuine tiered, marginal rate table — the same structure income tax brackets use — where each pricing tier's rate applies only to the users that fall within that tier's range, not the whole team, and computes a live blended cost-per-user that visibly falls as team size grows into higher tiers.
A marginal-bracket rate table, not a lookup-and-multiply
TIERS defines four bands: users 1–10 at \$15 each, 11–25 at \$12 each, 26–50 at \$9 each, and 51+ at \$6 each. The naive (and incorrect) way to implement "tiered pricing" is to look up which single bracket a team size falls into and multiply the whole team by that one rate — but that produces a cliff-edge discontinuity where adding one user to cross a tier boundary would retroactively discount every existing user too. computeTieredCost() avoids that entirely: it walks the tiers in order, and for each one takes only Math.min(remaining, tierCapacity) users at that tier's rate, exactly like a marginal tax bracket only taxes the income within each bracket, not your whole income at your top bracket's rate.
Working through a real example
At a team size of 18: the first 10 users bill at \$15 each (\$150), and the remaining 8 users fall into the 11–25 tier at \$12 each (\$96) — for a total of \$246. The average cost per user is \$246 ÷ 18 = \$13.67, genuinely lower than the base \$15 rate, and genuinely computed by dividing the real tiered total by the real team size, not a separately estimated "roughly \$14ish" figure.
The visual bar reflects the blended rate, not a decoration
The per-user cost bar's width is computed as (avg / BASE_RATE) * 100 — the actual blended average expressed as a percentage of the smallest-tier rate. As team size grows and more users fall into cheaper tiers, this percentage genuinely drops and the bar visibly shrinks, giving an at-a-glance sense of "how much of a volume discount am I actually getting" that a bare number doesn't communicate as immediately.
Showing which tiers are actually in play
Beneath the totals, every tier renders with how many of the current team's users are billed at that tier's rate (usersInTier), and the tier the team size currently extends into is visually highlighted. This makes the abstract rate table concrete: rather than just trusting the blended average, a visitor can see exactly which \$15, \$12, \$9, or \$6 users make up their total.
Customizing it
Edit the TIERS array to add, remove, or reprice bands — computeTieredCost(), the totals, the bar, and the tier list all recalculate correctly for any tier configuration, since none of the downstream code assumes a fixed number of tiers.
Build with AI
Build, Understand, Optimize, and Extend It With AI
Paste this snippet into an AI coding assistant like Claude and ask it to explain exactly why computeTieredCost() bills each tier only for the users within that tier's range (Math.min(remaining, tierCapacity)) rather than looking up one matching tier and multiplying the whole team by its rate, and why that distinction avoids a cliff-edge discontinuity at tier boundaries. It's also a good candidate to extend — ask it to add an annual-billing variant with a different discount curve, show a small chart of average cost per user across the full 1–200 range so the discount curve is visible at a glance, or add a "compare to flat-rate" toggle that shows how much more a non-tiered flat $15/user rate would have cost for the same team size.
Prompt to recreate it
Copy this into your AI assistant of choice to build the effect from scratch, or as a jumping-off point for your own variant:
Build a "cost per user" team pricing card with a genuine tiered (marginal-bracket) volume-discount rate table in plain HTML, CSS, and JavaScript, using no dependencies.

Requirements:
- Define a rate table of at least four tiers (e.g. 1–10 users, 11–25, 26–50, 51+), each with its own per-user rate that decreases at higher tiers, structured as a data array rather than hardcoded if/else branches.
- Implement the cost calculation as a genuine marginal/bracket calculation: for a given team size, each tier's rate must apply ONLY to the number of users that fall within that specific tier's range, not to the whole team — verify by hand that crossing a tier boundary (e.g. going from 10 to 11 users) does not retroactively change the rate applied to the first 10 users, avoiding a cliff-edge discontinuity.
- A team-size number input with stepper buttons and a sensible min/max range, where changing it live recalculates: the total monthly cost, and the average cost per user (total divided by team size, to two decimal places).
- A visual bar whose width represents the blended average cost-per-user as a percentage of the base (smallest-tier) rate, so the bar visibly shrinks as team size grows into cheaper tiers — this percentage must be a real computed ratio, not an arbitrary value.
- Below the bar, list every tier with its rate and, for the tier(s) the current team size actually spans, how many users are being billed at that specific rate — verify these per-tier user counts sum to the total team size.
- Write the tier calculation generically (iterating over the rate-table array) so adding, removing, or repricing a tier requires no other code changes to stay correct.
Want to tighten it up first? Run this prompt through the AI Prompt Studio to score it across 8 quality dimensions, catch anti-patterns, and tune the wording for Claude, ChatGPT, or Gemini before you paste it in.
Step by step
How to Use
- 1Adjust the team sizeUse the steppers or type a value between 1 and 200.
- 2Watch the total and average updateBoth are computed live from the real tiered rate table.
- 3Check the per-user barIts width reflects the blended rate as a percent of the base tier.
- 4See which tiers are billedThe tier list shows exactly how many users fall in each band.
- 5Cross a tier boundaryMove from 10 to 11 users and see the average drop as the new tier applies.
- 6Edit the TIERS arrayAdd, remove, or reprice bands — every computed value adapts automatically.
Real-world uses
Common Use Cases
Got questions?
Frequently Asked Questions
It is a genuine marginal-bracket structure: computeTieredCost() walks the TIERS array in order and bills only the users that fall within each band at that band's rate, using Math.min(remaining, tierCapacity) per tier. This is structurally identical to how income tax brackets work — it is not a lookup that finds one matching tier and multiplies the whole team by that single rate.
Because only the users within each tier's range are billed at that tier's rate — the first 10 users always cost $15 each regardless of total team size, and only users beyond 10 start billing at the lower $12 rate. This avoids the cliff-edge problem where crossing from 10 to 11 users would otherwise have to decide whether to re-price all 11 users at the new rate or just the new one, producing a jarring discontinuity either way.
Yes: the first 10 users bill at $15 each for $150, and the remaining 8 users (18 minus 10) fall into the 11–25 tier at $12 each for $96. $150 plus $96 is $246 total, and $246 divided by 18 users is $13.67 average cost per user — both figures are the direct output of computeTieredCost() and the division that follows it, not separately estimated.
It is the blended average cost per user (total divided by team size) expressed as a percentage of the base, smallest-tier rate ($15). As team size grows and more users fall into cheaper tiers, this blended average drops below the base rate and the percentage — and the bar's visual width — shrink accordingly, giving an immediate visual sense of how much volume discount is currently being applied.
Edit the TIERS array — add an object with an upTo boundary, a rate, and a label in the correct ascending order (or adjust an existing entry's rate or upTo value). Because computeTieredCost() and the rendering code iterate over TIERS generically rather than assuming exactly four bands, every computed total, average, bar width, and tier-usage line adapts automatically to the new configuration.