Source Code
<div class="wrap">
  <div class="ev-card">
    <div class="ev-head">
      <div>
        <h3>Model 3 · Garage</h3>
        <p class="ev-plug">Connected — AC Level 2, 7.4 kW</p>
      </div>
      <span class="ev-badge" id="evBadge">Charging</span>
    </div>

    <div class="ev-battery">
      <svg class="ev-battery-shell" width="120" height="60" viewBox="0 0 120 60">
        <rect x="2" y="2" width="106" height="56" rx="10" fill="none" stroke="#e2e8f0" stroke-width="3"/>
        <rect x="110" y="20" width="8" height="20" rx="3" fill="#e2e8f0"/>
        <clipPath id="battClip"><rect x="6" y="6" width="98" height="48" rx="7"/></clipPath>
        <rect id="battFill" x="6" y="6" width="0" height="48" rx="7" fill="#22c55e" clip-path="url(#battClip)"/>
      </svg>
      <div class="ev-pct-wrap">
        <span class="ev-pct" id="evPct">0%</span>
        <span class="ev-pct-label">charged</span>
      </div>
    </div>

    <div class="ev-stats">
      <div class="ev-stat">
        <span class="ev-stat-label">Range added</span>
        <span class="ev-stat-val" id="evRange">0 mi</span>
      </div>
      <div class="ev-stat">
        <span class="ev-stat-label">Time to full</span>
        <span class="ev-stat-val" id="evEta">--:--</span>
      </div>
      <div class="ev-stat">
        <span class="ev-stat-label">Est. cost</span>
        <span class="ev-stat-val" id="evCost">$0.00</span>
      </div>
    </div>

    <button class="ev-stop-btn" id="evStop">Stop charging</button>
  </div>
</div>
* { box-sizing: border-box; margin: 0; padding: 0; }
body { font-family: system-ui, -apple-system, sans-serif; background: #f8fafc; min-height: 100vh; display: flex; align-items: center; justify-content: center; padding: 32px 20px; }
.wrap { width: 100%; max-width: 380px; }
.ev-card { background: #0f172a; color: #fff; border-radius: 20px; padding: 22px; box-shadow: 0 18px 44px rgba(15,23,42,0.28); }
.ev-head { display: flex; align-items: flex-start; justify-content: space-between; margin-bottom: 18px; }
.ev-head h3 { font-size: 15px; font-weight: 800; }
.ev-plug { font-size: 12px; color: #94a3b8; margin-top: 3px; }
.ev-badge { font-size: 11px; font-weight: 800; padding: 5px 11px; border-radius: 999px; background: rgba(34,197,94,0.18); color: #4ade80; white-space: nowrap; }
.ev-badge.done { background: rgba(99,102,241,0.2); color: #a5b4fc; }
.ev-battery { display: flex; align-items: center; justify-content: center; gap: 18px; margin-bottom: 18px; padding: 14px 0; }
.ev-battery-shell { flex-shrink: 0; }
#battFill { transition: width 0.5s ease, fill 0.4s ease; }
.ev-pct-wrap { display: flex; flex-direction: column; }
.ev-pct { font-size: 30px; font-weight: 800; font-variant-numeric: tabular-nums; }
.ev-pct-label { font-size: 11.5px; color: #94a3b8; font-weight: 600; }
.ev-stats { display: grid; grid-template-columns: repeat(3, 1fr); gap: 10px; padding: 14px 0; border-top: 1px solid rgba(255,255,255,0.08); border-bottom: 1px solid rgba(255,255,255,0.08); margin-bottom: 16px; }
.ev-stat { display: flex; flex-direction: column; align-items: center; gap: 3px; }
.ev-stat-label { font-size: 10.5px; color: #94a3b8; font-weight: 600; text-transform: uppercase; letter-spacing: 0.03em; }
.ev-stat-val { font-size: 14px; font-weight: 800; font-variant-numeric: tabular-nums; }
.ev-stop-btn { width: 100%; padding: 11px; border-radius: 11px; border: 1px solid rgba(255,255,255,0.12); background: transparent; color: #f87171; font-size: 13px; font-weight: 700; cursor: pointer; transition: background 0.12s; }
.ev-stop-btn:hover { background: rgba(248,113,113,0.1); }
.ev-stop-btn:disabled { color: #64748b; cursor: default; background: transparent; }// Session configuration — swap for real values from the charger/vehicle telemetry API.
var START_PCT = 34;
var TARGET_PCT = 80;
var BATTERY_KWH = 75;
var CHARGE_RATE_KW = 7.4;
var MILES_PER_KWH = 3.5;
var COST_PER_KWH = 0.16;
var pct = START_PCT;
var running = true;
var battFill = document.getElementById('battFill');
var pctEl = document.getElementById('evPct');
var rangeEl = document.getElementById('evRange');
var etaEl = document.getElementById('evEta');
var costEl = document.getElementById('evCost');
var badgeEl = document.getElementById('evBadge');
var stopBtn = document.getElementById('evStop');
function colorForPct(p) {
if (p < 20) return '#ef4444';
if (p < 50) return '#f59e0b';
return '#22c55e';
}
function render() {
var w = (pct / 100) * 98; // 98 = inner clip width in the SVG viewBox
battFill.setAttribute('width', w.toFixed(1));
battFill.setAttribute('fill', colorForPct(pct));
pctEl.textContent = pct + '%';
var kwhAdded = ((pct - START_PCT) / 100) * BATTERY_KWH;
rangeEl.textContent = Math.max(0, Math.round(kwhAdded * MILES_PER_KWH)) + ' mi';
costEl.textContent = '$' + Math.max(0, kwhAdded * COST_PER_KWH).toFixed(2);
var remainingPct = Math.max(0, TARGET_PCT - pct);
var remainingKwh = (remainingPct / 100) * BATTERY_KWH;
var hoursLeft = remainingKwh / CHARGE_RATE_KW;
var totalMinutes = Math.max(0, Math.round(hoursLeft * 60));
var h = Math.floor(totalMinutes / 60);
var m = totalMinutes % 60;
etaEl.textContent = running && pct < TARGET_PCT
? h + 'h ' + String(m).padStart(2, '0') + 'm'
: '--:--';
}
function tick() {
if (!running || pct >= TARGET_PCT) {
if (pct >= TARGET_PCT) {
running = false;
badgeEl.textContent = 'Complete';
badgeEl.classList.add('done');
stopBtn.textContent = 'Charging complete';
stopBtn.disabled = true;
}
return;
}
pct = Math.min(TARGET_PCT, pct + 1);
render();
}
stopBtn.addEventListener('click', function () {
if (!running) return;
running = false;
badgeEl.textContent = 'Stopped';
badgeEl.style.background = 'rgba(148,163,184,0.18)';
badgeEl.style.color = '#cbd5e1';
stopBtn.textContent = 'Charging stopped';
stopBtn.disabled = true;
});
render();
setInterval(tick, 450);Learn Coding Visually
Learn to code with interactive, live-preview playgrounds — HTML, CSS, JavaScript, React & more.
 HTML Playground42 lessons · Click-based · Live preview
 CSS PlaygroundLearn CSS with a live editor
 JavaScript Playground60 lessons · DOM · Async · Canvas
 React PlaygroundLearn React with a live code editor
 GSAP PlaygroundLearn GSAP animation interactively
 SVG Playground44 lessons · shapes · paths · animation
 SCSS Playground45 lessons · Sass modules · tokens
 Tailwind PlaygroundLearn Tailwind CSS with a live editor
 Bootstrap 5 Playground50 lessons · live preview
EV Charging Status Card — Free HTML CSS JS Snippet
EV Charging Status Card · Cards · Plain HTML, CSS & JS · Live preview
What's included
Features
About this UI Snippet
EV Charging Status Card — Animated Battery, Live ETA & Cost Estimate
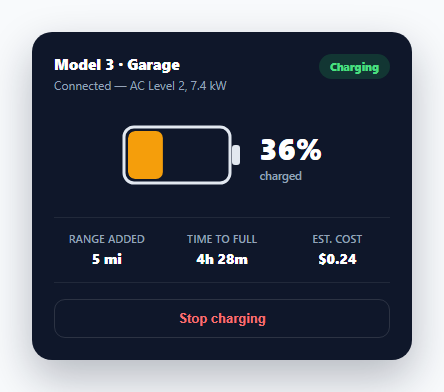
An EV charging screen has to answer three questions a driver actually cares about while they wait: how much battery is added, how much longer until it's done, and what is this session costing. This card ties all three to a single pct (current charge percentage) value, so as the battery fills, the range, ETA, and running cost recompute together instead of drifting out of sync with separately-tracked numbers.
One percentage value drives four different displays
pct is the only thing that changes on every tick(). The SVG battery fill's width attribute, the large percentage readout, the "range added" estimate, and the running cost are all recomputed from pct inside a single render() call. This is deliberate: a charging UI that tracked range and cost as independently-incrementing counters would risk them drifting out of sync with the percentage bar if any one calculation had a rounding bug — deriving everything from one source number rules that class of bug out entirely.
Why range and cost use kWh added, not kWh remaining
kwhAdded is computed as ((pct - START_PCT) / 100) * BATTERY_KWH — the *delta* since the session started, not the battery's current total charge. This matters because the driver's real question is "how much has *this* charging session given me," not "how full is the battery overall" (a battery that started at 34% and is now at 60% has added 26 percentage points of range and cost, and the card should show exactly that, not a number based on the full 60%).
Time-to-full derived from charge rate, not a countdown timer
Rather than counting down a separately-ticking clock (which could desync from the actual fill animation), etaEl's text is recalculated every tick from remainingKwh / CHARGE_RATE_KW — the battery capacity still needed to reach TARGET_PCT, divided by the charger's rate in kW. This means the ETA always reflects the true remaining distance to the *target* charge level (commonly 80%, not 100%, since most EV charging guidance caps daily charging there to preserve battery health) rather than an arbitrary fixed countdown.
Battery fill color as a secondary signal
colorForPct() shifts the battery's fill color from red below 20%, to amber up to 50%, to green above that — a quick-glance health indicator layered on top of the numeric percentage, similar to how a phone's battery icon changes color at low charge. The color and the numeric percentage are computed together in the same render() call so they can never show a contradictory state (like a green icon at 15%).
Stopping mid-session
The "Stop charging" button freezes pct at whatever the interval last reached rather than resetting anything — every other displayed value (range added, cost) remains correctly computed for the *partial* session, since they were always derived from the current pct, not from an assumption that charging would run to completion.
Build with AI
Build, Understand, Optimize, and Extend It With AI
Paste this snippet's HTML, CSS, and JS into an AI coding assistant like Claude and ask it to explain exactly why range added and cost are computed from the difference between the current percentage and the session's starting percentage, rather than from the current percentage alone, and what would go visually wrong if that subtraction were removed. The same assistant can help optimize it — for instance asking whether the time-to-full estimate should account for charging curves that slow down near the target percentage rather than assuming a constant charge rate the whole way. It's also useful for extending the card: ask it to add a charging-curve-aware ETA, a cost breakdown by peak/off-peak electricity rate, or a scheduled-start feature that delays charging until a cheaper rate window begins. Treat the code less like a finished artifact and more like a starting point for a conversation.
Prompt to recreate it
Copy this into your AI assistant of choice to build the effect from scratch, or as a jumping-off point for your own variant:
Build a live "EV charging status card" in plain HTML, CSS, and JavaScript — no framework, no charting library.

Requirements:
- Track exactly one numeric state value representing current battery charge percentage, plus separate constants for the session's starting percentage, a target percentage to charge to (not necessarily 100), total battery capacity in kWh, charger power in kW, an efficiency constant for converting kWh to miles or km of range, and a cost-per-kWh rate.
- Render a battery indicator (an SVG or styled div is fine) whose fill width and fill color are both derived from the single current percentage value inside one update function — the fill color should shift through at least three distinct color states as percentage increases (for example a low-charge warning color, a mid-range color, and a healthy color).
- Compute "range added" and "estimated cost" from the energy added since the session started (current percentage minus the starting percentage, converted to kWh) — not from the battery's total current charge — so a session that started partway full reports figures for only what this session actually added.
- Compute a "time to full" estimate on every update as the remaining kWh needed to reach the target percentage divided by the charger's power in kW, converted to a hours-and-minutes display, rather than counting down a separately-ticking timer that could desync from the actual charge value.
- Automatically transition to a distinct "complete" visual state once the current percentage reaches the target percentage, and provide a "stop charging" button that freezes the session at its current percentage (leaving all the other derived numbers correctly reflecting a partial session) and disables further charging progress.
- Simulate live charging progress with a repeating timer that increments the percentage, structured so replacing the timer with a real charger API callback would only require changing where the percentage value gets set.
Want to tighten it up first? Run this prompt through the AI Prompt Studio to score it across 8 quality dimensions, catch anti-patterns, and tune the wording for Claude, ChatGPT, or Gemini before you paste it in.
Step by step
How to Use
- 1Watch it chargepct increments automatically toward TARGET_PCT — the battery fill, percentage, range, ETA, and cost all update together every tick.
- 2Set the session parametersEdit START_PCT, TARGET_PCT, BATTERY_KWH, CHARGE_RATE_KW, MILES_PER_KWH, and COST_PER_KWH at the top of the JS to match a real vehicle and charger.
- 3Connect real charger telemetryReplace the setInterval(tick, 450) simulation with a callback from your charger or vehicle API that sets pct directly, then calls render().
- 4Adjust the color thresholdsEdit the percentage cutoffs inside colorForPct() to change when the battery fill switches from red to amber to green.
- 5Wire up Stop chargingReplace the click handler's local state change with an actual API call to halt the charger session, then update the badge on a successful response.
- 6Export in your formatClick "HTML" for a standalone file, "JSX" for a React component, or "Tailwind" for a Tailwind CSS version.
Real-world uses
Common Use Cases
Got questions?
Frequently Asked Questions
Counting down a separate timer risks it drifting out of sync with the actual battery fill percentage. Instead, etaEl is recalculated from remainingKwh (target minus current charge) divided by CHARGE_RATE_KW on every tick, so the ETA always reflects the true remaining distance to TARGET_PCT even if the fill rate changes.
kwhAdded is (pct - START_PCT) / 100 * BATTERY_KWH — the energy added during this specific session, not the battery's overall state of charge. This matches what a driver actually wants to know: what did this charging session give me, not how full is the battery overall.
TARGET_PCT defaults to 80 because many EV manufacturers recommend daily charging to around 80% rather than 100% to reduce long-term battery degradation, reserving a full charge for longer trips. Change TARGET_PCT to 100 if your use case needs a full-charge session.
Remove the setInterval(tick, 450) simulation and instead call render() whenever your charger or vehicle telemetry API delivers a new percentage reading, after setting the pct variable to that real value.
colorForPct() returns red below 20%, amber from 20-49%, and green from 50% up — computed fresh every render() call from the same pct value used everywhere else on the card, so the color can never contradict the displayed percentage.
pct freezes at its current value, running is set to false, and the badge and button update to a stopped state. Because range added and cost were always derived from the current pct rather than an assumption of reaching TARGET_PCT, they remain correct for the partial session with no extra logic needed.