You Might Also Like
Learn Coding Visually
Learn to code with interactive, live-preview playgrounds — HTML, CSS, JavaScript, React & more.
 HTML Playground42 lessons · Click-based · Live preview
 CSS PlaygroundLearn CSS with a live editor
 JavaScript Playground60 lessons · DOM · Async · Canvas
 React PlaygroundLearn React with a live code editor
 GSAP PlaygroundLearn GSAP animation interactively
 SVG Playground44 lessons · shapes · paths · animation
 SCSS Playground45 lessons · Sass modules · tokens
 Tailwind PlaygroundLearn Tailwind CSS with a live editor
 Bootstrap 5 Playground50 lessons · live preview
Traffic Light FSM Visualizer — Free JS State Machine Snippet
Traffic Light FSM Visualizer · Animations · Plain HTML, CSS & JS · Live preview
What's included
Features
About this UI Snippet
Traffic Light Finite State Machine Visualizer — Diagram, Transition Table & Working Signal in Vanilla JS
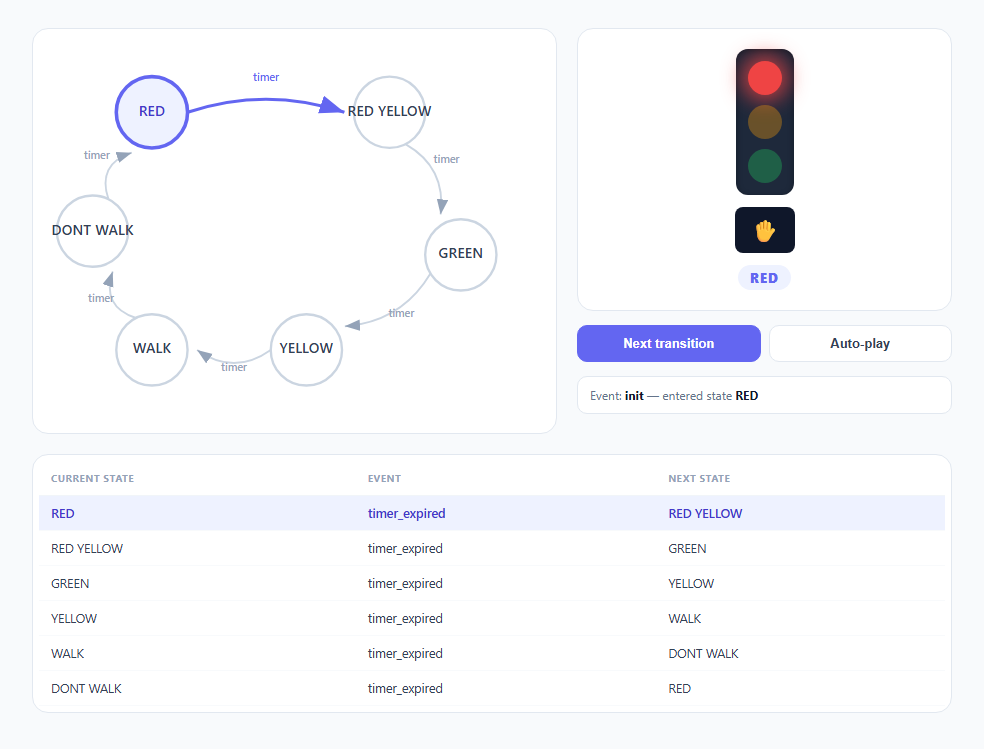
A finite state machine (FSM) is one of the oldest and most reusable ideas in software: a system has a fixed set of named states, it is only ever in exactly one of them at a time, and it moves between states through well-defined events. This snippet makes that abstract idea concrete by pairing a live node-and-arrow diagram with an actual working traffic light, so the diagram and the UI move in perfect lockstep — click "Next transition" and watch the same change happen in the graph, the physical-looking signal head, and a plain-English transition table at the same time.
The data model is the whole lesson
Everything is driven by one object: TRANSITIONS, keyed by current state name, where each entry is an array of { event, next } pairs describing which events are valid from that state and which state they lead to. RED only accepts timer_expired and only ever goes to RED_YELLOW. There is no giant if/else chain and no scattered boolean flags like isRed, wasYellow, pedestrianTurn — a single lookup table is both the documentation and the executable logic. This is exactly the shape you would use for an order-status pipeline (PENDING → PAID → SHIPPED → DELIVERED), a multi-step signup wizard, a media player's play/pause/buffer states, or a game character's idle/walk/attack states. Once you see the pattern here you can lift the TRANSITIONS object structure directly into any of those problems.
Six states, not three
Most "traffic light" demos stop at red/yellow/green, but a real intersection controller has more nuance: this one adds a RED_YELLOW transitional state (used in many countries to warn drivers the green is coming) and a full pedestrian cycle (WALK / DONT_WALK) that shares the red phase. Modeling six states instead of three is what makes the FSM pattern legible — with only three states it is tempting to just cycle an array index, but six states with asymmetric behavior (the walk sign only changes during the red phase) forces you to actually use the event/transition lookup rather than a shortcut.
Drawing the diagram procedurally with SVG
The graph is not hand-drawn markup — buildDiagram() reads a LAYOUT object mapping each state name to an (x, y) coordinate, then generates SVG <circle>, <text>, and curved <path> elements with document.createElementNS. Edge curves use a quadratic Bezier whose control point is offset perpendicular to the straight line between two nodes (midX/midY nudged along the normal direction (dy/dist, -dx/dist)), which is what keeps the arrows visually separated instead of overlapping straight lines. Arrowheads are SVG <marker> elements referenced by marker-end, so the arrow head recolors automatically when the active class swaps the path's stroke color — no separate arrowhead element to keep in sync.
Highlighting active state and the just-taken transition
Every state transition calls a single paint() function that toggles an .active class based on a simple dataset comparison (el.dataset.state === current), applied identically to the SVG nodes, the SVG edges, and the transition table rows. Because all three views read from the exact same current variable and the exact same class-toggle logic, the diagram, the table, and the signal light can never visually disagree with each other — there is only one source of truth.
Driving a real signal head from the same state
The physical-looking signal — three lamp <div>s with a glow effect from box-shadow, plus a separate pedestrian sign — is just another consumer of current. paint() maps each of the six state names to which lamps get the .on class and what the walk sign shows, meaning the visual traffic light is not simulated independently; it is a direct rendering of the same FSM state that drives the diagram. This is the same separation you would use in production: one authoritative state variable, and any number of "view" functions that render from it.
Manual stepping and timed auto-play
step() looks up the single valid transition for the current state, updates current, calls paint(), and logs the event that fired. setAuto() wraps that same step() call in a setInterval, so auto-play is not a separate code path — it is the identical transition function fired on a timer instead of a click. Toggling auto-play off calls clearInterval and nulls the timer reference, which matters when porting this into a component framework: that timer must be torn down on unmount or it keeps firing against a detached DOM.
Build with AI
Build, Understand, Optimize, and Extend It With AI
Paste this snippet's JS into an AI assistant like Claude and ask it to walk through why the perpendicular-offset math in buildDiagram() (the dy/dist, -dx/dist terms) is what curves the edges instead of drawing straight overlapping lines — it is a small but genuinely useful piece of vector math worth understanding once. From there, good extensions to ask for: support branching transitions with multiple events per state and buttons to choose which one fires, animate the arrowhead traveling along the path during a transition instead of just recoloring it, or auto-generate the LAYOUT coordinates in a circle for an arbitrary number of states so the diagram scales past six nodes without manual positioning.
Prompt to recreate it
Copy this into your AI assistant of choice to build the effect from scratch, or as a jumping-off point for your own variant:
Build a finite-state-machine visualizer in plain HTML, CSS, and JavaScript that shows a live diagram driving a real traffic light UI, no libraries.

Requirements:
- Define the state machine as one plain JavaScript object keyed by current-state name, where each value is an array of {event, next} transition objects — this object must be the single source of truth, not a separate switch statement.
- Model at least five or six states for a realistic light cycle (e.g. red, red+yellow, green, yellow, and a pedestrian walk/don't-walk phase), not just three.
- Procedurally generate an SVG diagram from a layout object mapping each state name to x/y coordinates: circular nodes with labels, and curved arrows (quadratic Bezier, offset perpendicular to the straight line between nodes) connecting each state to its next state, using SVG marker elements for arrowheads.
- Render an actual traffic-light graphic (three lamp elements plus a pedestrian sign) whose lit lamp and sign are derived from the exact same "current state" variable that drives the diagram, so they can never visually disagree.
- Provide a manual "Next transition" button that advances one step, and a toggleable auto-play mode that calls the identical step function on a setInterval, cleanly clearable when toggled off.
- Highlight the active diagram node and the just-taken transition arrow distinctly from inactive ones, and show a small transition table listing every state, its event, and its next state, with the current row highlighted.
- Log each transition in a small readable line like "event — fromState -> toState" so the mechanism is legible without reading the console.
Want to tighten it up first? Run this prompt through the AI Prompt Studio to score it across 8 quality dimensions, catch anti-patterns, and tune the wording for Claude, ChatGPT, or Gemini before you paste it in.
Step by step
How to Use
- 1Look at the diagram and the signal togetherSix circular nodes are connected by curved arrows in a loop. The currently active node glows indigo, and the real traffic-light graphic below shows the matching lamp lit or the walk sign showing.
- 2Click "Next transition"The active node moves to the next state in the diagram, the arrow you just followed briefly highlights, the signal lamps swap, and a log line appears describing the event that fired, e.g. "timer_expired — RED → RED YELLOW".
- 3Watch the transition table updateThe row matching the current state is highlighted in the table below the diagram, showing exactly which event and next-state pair the state machine just used — the same data driving the graph.
- 4Toggle Auto-playClick "Auto-play" to have the machine step itself every 1.4 seconds. The button turns green and shows "Auto-play: on" while it runs; click again to stop it mid-cycle.
- 5Follow a full cycleLet it run through all six states — red, red+yellow, green, yellow, walk, don't walk — and back to red, noticing the pedestrian phase only appears during the red-light portion of the cycle.
- 6Read the code as a templateOpen the JS tab and look at the TRANSITIONS object — that lookup table is the reusable pattern; everything else (SVG diagram, lamps, table) is just a renderer for whatever state that object says is current.
Real-world uses
Common Use Cases
Got questions?
Frequently Asked Questions
Add the state name to the STATES array, add its position to the LAYOUT object (x, y coordinates on the 420x320 SVG canvas), and add an entry to TRANSITIONS mapping it to the event and next state you want. No other code needs to change — buildDiagram(), buildTable(), and paint() all iterate over STATES and TRANSITIONS generically.
Yes conceptually — TRANSITIONS[state] is already an array, this demo just uses one entry per state for a simple deterministic cycle. To support branching, extend TRANSITIONS[state] with multiple {event, next} objects, render one arrow per entry in buildDiagram(), and add buttons or condition checks in step() that pick which transition to fire based on the actual event that occurred, not just nextOf(state)[0].
Keeping a single paint() function that reads the current variable and re-renders every view (diagram, lamps, table) guarantees they can never drift out of sync. If step() manually updated the diagram in one place and the lamps in another, a future edit to one path but not the other would silently break the visual link between them — a classic bug class this pattern avoids entirely.
Yes. Keep TRANSITIONS and LAYOUT as plain constants outside the component. In React, hold current in useState and call your paint-equivalent as a render derived from that state rather than direct DOM classList toggles; run setAuto's setInterval inside a useEffect and return a cleanup function that calls clearInterval. In Vue, use a ref for current inside onMounted/onUnmounted with the same interval cleanup; in Angular, start the interval in ngAfterViewInit and clear it in ngOnDestroy so the timer does not keep firing against a destroyed component.
The LAYOUT object accepts any coordinate pair per state, so you can lay out ten or twenty states in a grid or circle by computing coordinates programmatically (e.g. placing N states evenly around a circle with trigonometry) instead of hand-picking each x/y. The Bezier edge-curving logic in buildDiagram() works for any two coordinates, so it scales past six states without modification.