



Learn Coding Visually
Learn to code with interactive, live-preview playgrounds — HTML, CSS, JavaScript, React & more.
 HTML Playground42 lessons · Click-based · Live preview
 CSS PlaygroundLearn CSS with a live editor
 JavaScript Playground60 lessons · DOM · Async · Canvas
 React PlaygroundLearn React with a live code editor
 GSAP PlaygroundLearn GSAP animation interactively
 SVG Playground44 lessons · shapes · paths · animation
 SCSS Playground45 lessons · Sass modules · tokens
 Tailwind PlaygroundLearn Tailwind CSS with a live editor
 Bootstrap 5 Playground50 lessons · live preview
Tax Bracket Estimator — Free HTML CSS JS Snippet
Tax Bracket Estimator · Misc · Plain HTML, CSS & JS · Live preview
What's included
Features
About this UI Snippet
Tax Bracket Estimator — Progressive Marginal Tax Calculation with Effective vs Marginal Rate Breakdown
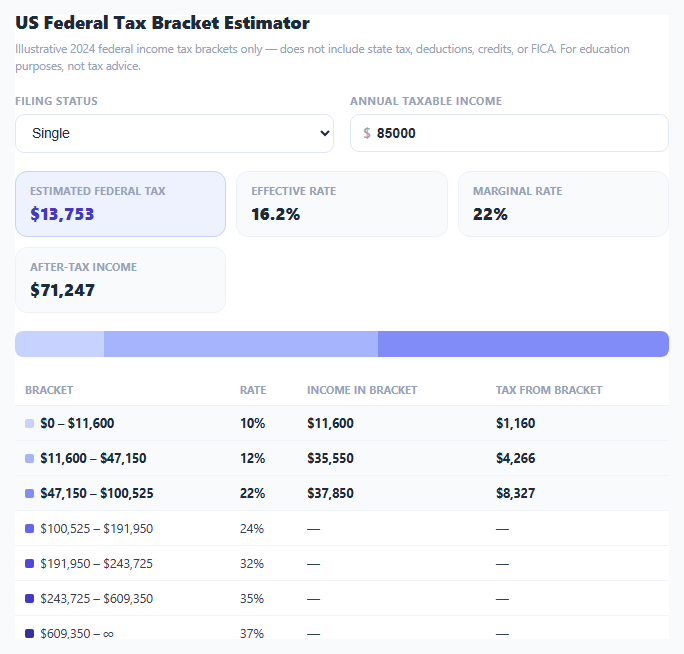
The most common misunderstanding about a progressive tax system is thinking that landing in a higher bracket means *all* of your income gets taxed at that bracket's rate. This snippet computes tax the way it actually works — only the income that falls within each bracket's range is taxed at that bracket's rate — and visualizes the resulting difference between your marginal rate (the rate on your next dollar) and your effective rate (the blended rate across your whole income).
The bracket data structure: cumulative thresholds, not per-bracket widths
BRACKETS stores each bracket as { rate, upTo }, where upTo is the cumulative income ceiling for that bracket (not the bracket's width) — for example the 2024 single-filer table's second bracket is { rate: 0.12, upTo: 47150 }, meaning income up to $47,150 total is taxed at 12% or less. This cumulative representation is what real published IRS bracket tables look like, and the calculation logic derives each bracket's actual width from the *difference* between consecutive upTo values rather than storing that width directly — closer to the source data and less error-prone to keep updated for future tax years.
Walking the brackets: remaining income allocated bracket by bracket
calculate() tracks remaining (income not yet accounted for) and prevCap (the previous bracket's ceiling) as it walks the bracket list in order. For each bracket, bracketSize = b.upTo - prevCap gives that bracket's width, and taxableInThisBracket = Math.max(0, Math.min(remaining, bracketSize)) clamps the amount actually taxed in this bracket to whichever is smaller — the bracket's capacity or however much income is left to allocate. This is the literal mechanical definition of a marginal tax system: fill the lowest bracket first, then the next, until you run out of income or brackets.
Marginal rate is simply the rate of the last bracket touched
As the loop processes each bracket, it updates marginalRate = b.rate only when taxableInThisBracket > 0 — meaning the final value left after the loop is exactly the rate of the highest bracket your income actually reaches, which by definition is your marginal rate: the rate applied to your next additional dollar of income.
Effective rate: total tax divided by total income, not read off the bracket table
The effective rate isn't looked up anywhere — it's computed directly as totalTax / income after summing every bracket's contribution. Because lower brackets are taxed at lower rates than the marginal bracket, the effective rate is always meaningfully below the marginal rate for anyone spanning multiple brackets — the summary cards deliberately show both side by side so the gap between them is visible rather than implied.
The proportional bracket bar
The colored bar segments are sized by taxableInThisBracket / totalTaxable, so the bar's visual width directly represents how much of your actual income sits in each bracket — a quick visual gut-check that most people's income, even well into the higher brackets, still has the bulk of its *dollars* taxed at the lower rates first.
This tool uses illustrative 2024 IRS federal brackets for single and married-filing-jointly status only. It deliberately excludes deductions, credits, FICA (Social Security/Medicare), and state tax — a complete tax calculation involves inputs and rules well beyond what a self-contained client-side snippet should attempt, and the disclaimer text says so explicitly.
Build with AI
Build, Understand, Optimize, and Extend It With AI
Give this snippet's JavaScript to an AI assistant like Claude and ask it to explain step by step how the bracket-walking loop correctly avoids the "taxed at my top rate on all income" mistake — tracing through a concrete income example makes the marginal-vs-effective distinction very clear. It's also a natural base to extend: ask for a standard-deduction input that reduces taxable income before the bracket calculation runs, a side-by-side comparison of two income scenarios, or additional filing statuses like Head of Household.
Prompt to recreate it
Copy this into your AI assistant of choice to build the effect from scratch, or as a jumping-off point for your own variant:
Build a US federal income tax bracket estimator in plain HTML, CSS, and JavaScript, no libraries.

Requirements:
- Store the 2024 IRS federal tax brackets (seven rates from 10% to 37%) for both Single and Married Filing Jointly filing statuses as cumulative income thresholds, matching how published bracket tables are structured.
- A filing-status dropdown and a numeric income input, recalculating live on every change.
- Implement real progressive marginal tax calculation: walk the brackets from lowest to highest, and for each bracket only tax the portion of income that actually falls within that bracket's range (the difference between its threshold and the previous bracket's threshold), not the full income at that bracket's rate.
- Clearly compute and display both the marginal rate (the rate of the highest bracket the income reaches) and the effective rate (total tax divided by total income) as two visually distinct, separately labeled figures, since confusing the two is the most common tax misconception.
- Show a proportional horizontal bar where each bracket's segment width represents how much of the total income actually falls in that bracket.
- Show a table with one row per bracket, highlighting only the brackets the income actually reaches, with the exact taxable amount and tax dollar amount contributed by each bracket.
- Include a visible disclaimer that the tool excludes deductions, credits, FICA, and state tax, and is illustrative only, not tax advice.
Want to tighten it up first? Run this prompt through the AI Prompt Studio to score it across 8 quality dimensions, catch anti-patterns, and tune the wording for Claude, ChatGPT, or Gemini before you paste it in.
Source Code
<div class="wrap">
  <h2>US Federal Tax Bracket Estimator</h2>
  <p class="disclaimer">Illustrative 2024 federal income tax brackets only — does not include state tax, deductions, credits, or FICA. For education purposes, not tax advice.</p>

  <div class="controls">
    <div class="field">
      <label>Filing status</label>
      <select id="status-select">
        <option value="single">Single</option>
        <option value="married">Married Filing Jointly</option>
      </select>
    </div>
    <div class="field">
      <label>Annual taxable income</label>
      <div class="income-input-row">
        <span class="dollar">$</span>
        <input type="number" id="income-input" value="85000" min="0" step="1000" />
      </div>
    </div>
  </div>

  <div class="summary-cards" id="summary-cards"></div>

  <div class="bracket-bar" id="bracket-bar"></div>

  <div class="bracket-table-wrap">
    <table class="bracket-table">
      <thead><tr><th>Bracket</th><th>Rate</th><th>Income in bracket</th><th>Tax from bracket</th></tr></thead>
      <tbody id="bracket-tbody"></tbody>
    </table>
  </div>
</div>
* { box-sizing: border-box; margin: 0; padding: 0; }
body { font-family: system-ui, -apple-system, sans-serif; background: #f8fafc; min-height: 100vh; padding: 28px 20px; }
.wrap { max-width: 700px; margin: 0 auto; background: #fff; border: 1px solid #e2e8f0; border-radius: 16px; padding: 22px; }
h2 { font-size: 18px; font-weight: 800; color: #1e293b; margin-bottom: 6px; }
.disclaimer { font-size: 11.5px; color: #94a3b8; line-height: 1.5; margin-bottom: 18px; }
.controls { display: flex; gap: 16px; flex-wrap: wrap; margin-bottom: 18px; }
.field { flex: 1; min-width: 180px; }
.field label { display: block; font-size: 11px; font-weight: 700; color: #94a3b8; text-transform: uppercase; letter-spacing: 0.04em; margin-bottom: 6px; }
#status-select { width: 100%; padding: 10px 12px; border: 1.5px solid #e2e8f0; border-radius: 9px; font-size: 13.5px; color: #1e293b; background: #fff; }
.income-input-row { display: flex; align-items: center; border: 1.5px solid #e2e8f0; border-radius: 9px; padding: 0 12px; }
.income-input-row:focus-within { border-color: #6366f1; }
.dollar { color: #94a3b8; font-size: 14px; font-weight: 600; }
#income-input { flex: 1; border: none; padding: 10px 0 10px 6px; font-size: 14px; font-weight: 700; color: #1e293b; }
#income-input:focus { outline: none; }
select:focus { outline: none; border-color: #6366f1; }
.summary-cards { display: grid; grid-template-columns: repeat(3, 1fr); gap: 10px; margin-bottom: 18px; }
.summary-card { background: #f8fafc; border: 1px solid #eef2f7; border-radius: 12px; padding: 12px 14px; }
.summary-card .k { font-size: 10.5px; font-weight: 700; color: #94a3b8; text-transform: uppercase; letter-spacing: 0.04em; margin-bottom: 4px; }
.summary-card .v { font-size: 17px; font-weight: 800; color: #1e293b; }
.summary-card.accent { background: #eef2ff; border-color: #c7d2fe; }
.summary-card.accent .v { color: #4338ca; }
.bracket-bar { display: flex; height: 26px; border-radius: 8px; overflow: hidden; margin-bottom: 18px; }
.bracket-bar .seg { transition: width 0.3s; }
.bracket-table-wrap { overflow-x: auto; }
.bracket-table { width: 100%; border-collapse: collapse; font-size: 12.5px; }
.bracket-table th { text-align: left; padding: 8px 10px; color: #94a3b8; font-weight: 700; text-transform: uppercase; font-size: 10.5px; letter-spacing: 0.03em; border-bottom: 1.5px solid #eef2f7; }
.bracket-table td { padding: 9px 10px; border-bottom: 1px solid #f1f5f9; color: #334155; }
.bracket-table tr.active-bracket td { background: #f8fafc; font-weight: 700; color: #1e293b; }
.bracket-table .swatch { display: inline-block; width: 9px; height: 9px; border-radius: 2px; margin-right: 6px; }const BRACKETS = {
single: [
{ rate: 0.10, upTo: 11600 },
{ rate: 0.12, upTo: 47150 },
{ rate: 0.22, upTo: 100525 },
{ rate: 0.24, upTo: 191950 },
{ rate: 0.32, upTo: 243725 },
{ rate: 0.35, upTo: 609350 },
{ rate: 0.37, upTo: Infinity },
],
married: [
{ rate: 0.10, upTo: 23200 },
{ rate: 0.12, upTo: 94300 },
{ rate: 0.22, upTo: 201050 },
{ rate: 0.24, upTo: 383900 },
{ rate: 0.32, upTo: 487450 },
{ rate: 0.35, upTo: 731200 },
{ rate: 0.37, upTo: Infinity },
],
};
const COLORS = ['#c7d2fe', '#a5b4fc', '#818cf8', '#6366f1', '#4f46e5', '#4338ca', '#3730a3'];
function fmt(n) {
return '$' + Math.round(n).toLocaleString();
}
function calculate() {
const status = document.getElementById('status-select').value;
const income = Math.max(0, Number(document.getElementById('income-input').value) || 0);
const brackets = BRACKETS[status];
let remaining = income;
let prevCap = 0;
let totalTax = 0;
const rows = [];
let marginalRate = brackets[0].rate;
brackets.forEach((b, i) => {
const bracketSize = b.upTo - prevCap;
const taxableInThisBracket = Math.max(0, Math.min(remaining, bracketSize));
const taxFromBracket = taxableInThisBracket * b.rate;
totalTax += taxFromBracket;
if (taxableInThisBracket > 0) marginalRate = b.rate;
rows.push({
label: prevCap === 0 ? fmt(0) + ' \u2013 ' + fmt(b.upTo) : fmt(prevCap) + ' \u2013 ' + (b.upTo === Infinity ? '\u221E' : fmt(b.upTo)),
rate: b.rate,
taxableInThisBracket,
taxFromBracket,
color: COLORS[i],
});
remaining -= taxableInThisBracket;
prevCap = b.upTo;
});
const effectiveRate = income > 0 ? totalTax / income : 0;
const takeHome = income - totalTax;
document.getElementById('summary-cards').innerHTML = [
['Estimated Federal Tax', fmt(totalTax), true],
['Effective Rate', (effectiveRate * 100).toFixed(1) + '%', false],
['Marginal Rate', (marginalRate * 100).toFixed(0) + '%', false],
].map(([k, v, accent]) =>
'<div class="summary-card' + (accent ? ' accent' : '') + '"><div class="k">' + k + '</div><div class="v">' + v + '</div></div>'
).join('') + '<div class="summary-card"><div class="k">After-Tax Income</div><div class="v">' + fmt(takeHome) + '</div></div>';
const activeRows = rows.filter(r => r.taxableInThisBracket > 0);
const totalTaxable = activeRows.reduce((s, r) => s + r.taxableInThisBracket, 0) || 1;
document.getElementById('bracket-bar').innerHTML = activeRows.map(r =>
'<div class="seg" style="width:' + (r.taxableInThisBracket / totalTaxable * 100) + '%; background:' + r.color + '"></div>'
).join('');
document.getElementById('bracket-tbody').innerHTML = rows.map(r =>
'<tr class="' + (r.taxableInThisBracket > 0 ? 'active-bracket' : '') + '">' +
'<td><span class="swatch" style="background:' + r.color + '"></span>' + r.label + '</td>' +
'<td>' + (r.rate * 100).toFixed(0) + '%</td>' +
'<td>' + (r.taxableInThisBracket > 0 ? fmt(r.taxableInThisBracket) : '\u2014') + '</td>' +
'<td>' + (r.taxFromBracket > 0 ? fmt(r.taxFromBracket) : '\u2014') + '</td>' +
'</tr>'
).join('');
}
document.getElementById('status-select').addEventListener('change', calculate);
document.getElementById('income-input').addEventListener('input', calculate);
calculate();Step by step
How to Use
- 1Choose a filing statusSelect Single or Married Filing Jointly — each uses its own published bracket thresholds.
- 2Enter your annual taxable incomeType a dollar amount; results recalculate live on every keystroke.
- 3Read the summary cardsSee estimated total federal tax, your effective (blended) rate, your marginal (top-bracket) rate, and after-tax income at a glance.
- 4Study the proportional bracket barEach colored segment's width shows exactly how much of your income falls into that bracket, in proportion to your total taxable income.
- 5Check the per-bracket tableHighlighted rows show which brackets you actually reach, with the exact income and tax amount contributed by each one.
- 6Compare scenariosAdjust the income field to see how crossing into a new bracket only affects the additional income above that threshold, not your entire income.
Real-world uses
Common Use Cases
Got questions?
Frequently Asked Questions
No — this is the single most common tax misconception, and it's false. Only the income that falls within a given bracket's range is taxed at that bracket's rate; income in lower brackets keeps being taxed at their lower rates regardless of what bracket your top dollar reaches. The per-bracket table in this tool shows exactly that: it never taxes your full income at your marginal rate.
Marginal rate is the tax rate applied to your next additional dollar of income — the rate of the highest bracket you reach. Effective rate is your total tax divided by your total income — a blended average across every bracket your income passed through. Effective rate is always lower than or equal to marginal rate for anyone spanning more than one bracket.
This tool deliberately omits the standard deduction or itemized deductions, tax credits (child tax credit, earned income credit, etc.), FICA payroll taxes (Social Security and Medicare), state and local income tax, and any other adjustments to income. It estimates federal income tax on a given taxable income figure only — treat it as illustrative, not as tax advice or a substitute for a real tax preparer or software.
The 2024 IRS federal bracket thresholds for Single and Married Filing Jointly filing statuses. Bracket thresholds are adjusted annually for inflation, so the exact dollar cutoffs shift slightly year to year even though the seven marginal rates (10% through 37%) have stayed the same since the 2017 Tax Cuts and Jobs Act.
The calculator walks the brackets from lowest to highest, tracking how much income remains unallocated. For each bracket, it takes the smaller of that bracket's width (the difference between its ceiling and the previous bracket's ceiling) and whatever income is still remaining — that is exactly how marginal taxation fills each bracket before spilling into the next.