You Might Also Like
Learn Coding Visually
Learn to code with interactive, live-preview playgrounds — HTML, CSS, JavaScript, React & more.
 HTML Playground42 lessons · Click-based · Live preview
 CSS PlaygroundLearn CSS with a live editor
 JavaScript Playground60 lessons · DOM · Async · Canvas
 React PlaygroundLearn React with a live code editor
 GSAP PlaygroundLearn GSAP animation interactively
 SVG Playground44 lessons · shapes · paths · animation
 SCSS Playground45 lessons · Sass modules · tokens
 Tailwind PlaygroundLearn Tailwind CSS with a live editor
 Bootstrap 5 Playground50 lessons · live preview
Scroll Data Story Counters — Free GSAP ScrollTrigger Scrub-Driven Metrics
Scroll Data Story Counters · Scroll · Plain HTML, CSS & JS · Live preview
What's included
Features
About this UI Snippet
Scroll Data Story Counters — Numbers That ARE Your Scroll Position
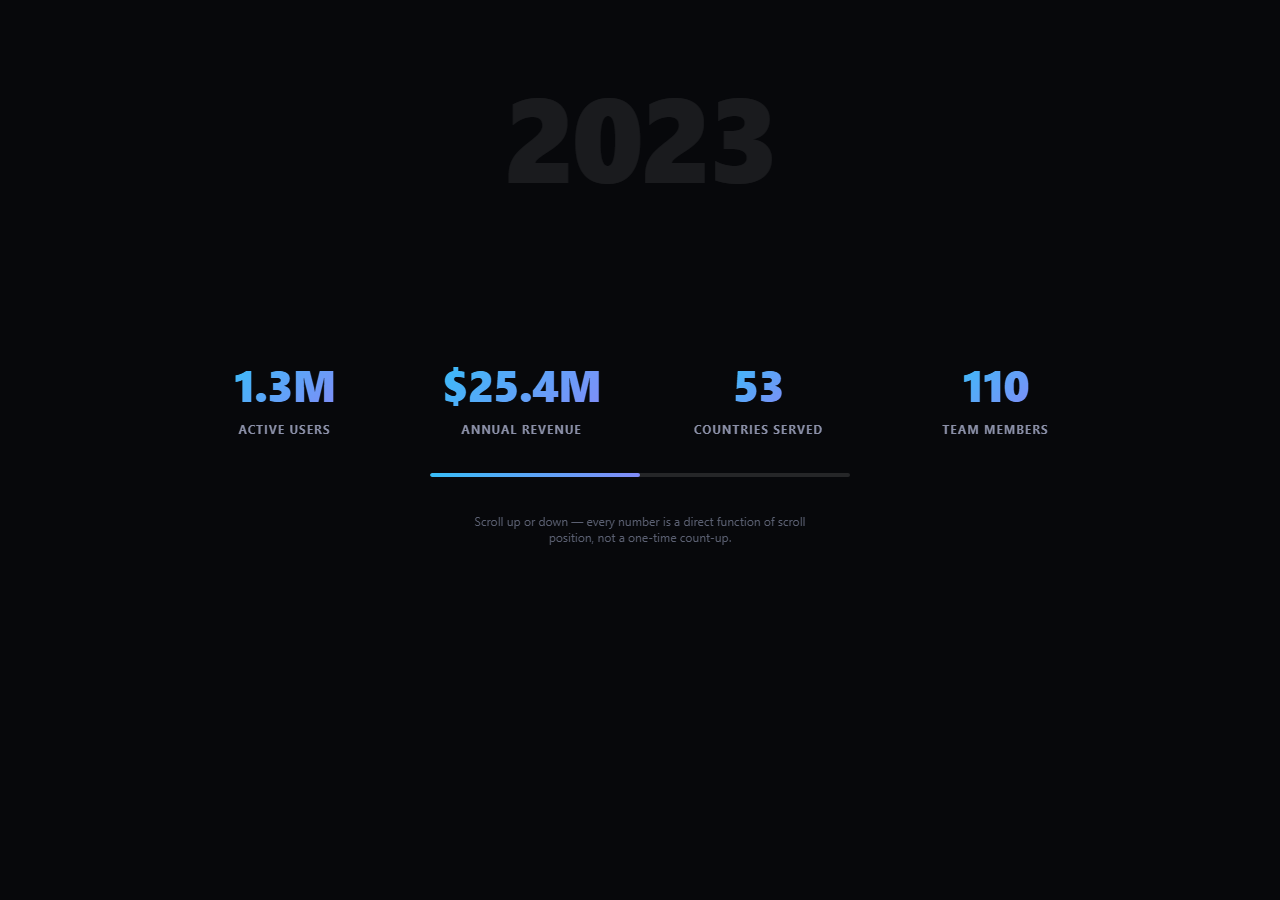
Most "count up on scroll" effects trigger a fixed-duration animation once a number enters the viewport — useful, but the count-up always runs the same way regardless of exactly where or how fast you scrolled. This snippet does something different: every metric's displayed value is computed live, every frame, as a direct linear function of scroll progress, so scrubbing to any point in the pinned section deterministically produces the exact same numbers every time.
`scrub`, not `onEnter`, is the entire mechanism
A single ScrollTrigger with scrub: 0.3 covers the whole pinned section. Its onUpdate callback receives self.progress — a 0-to-1 value tied directly to scroll position — and for every metric computes from + (to - from) * progress, a plain linear interpolation. There is no duration, no easing curve, no "play once" state to track: the number at any scroll position is pure arithmetic on that position, which is what makes scrolling backward instantly and exactly reverse-correct rather than needing to "un-animate."
Four metrics, one shared progress value, zero drift
Every metric object in the METRICS array — users, revenue, countries, team size — reads the exact same p value inside the same onUpdate call. Because all four numbers, the year label, and the scrub-progress fill bar are derived from one shared variable in one function call, they can never fall out of sync with each other the way four independently-triggered count-up animations with different durations could.
Per-metric formatting, shared interpolation
Each metric supplies its own format(n) function — users abbreviate to K/M, revenue gets a dollar sign and one decimal, countries and team size round to whole numbers — while the interpolation math itself (from + (to - from) * progress) is completely generic and metric-agnostic. Adding a fifth metric is adding one object to the array with its own from, to, and format; the scrub loop needs no changes.
A light scrub value, not zero
scrub: 0.3 (rather than scrub: true, which is equivalent to instantaneous 1:1 tracking) adds a small easing lag that smooths out jittery trackpad or mouse-wheel input, without meaningfully breaking the "value equals position" contract — the lag settles within a couple hundred milliseconds, which is imperceptible compared to the multi-thousand-pixel scroll range the counters interpolate across.
How this differs from a count-up-on-enter pattern
The scroll stat reveal story snippet in this library counts up once, with its own fixed duration and easing, the first time a stat scrolls into view — good for a single dramatic reveal per stat. This snippet instead ties every value continuously to scroll position for the entire pinned section, better suited to narrating change *over* a range (a multi-year growth story) rather than revealing one static end value.
Customizing it
Add metrics to the array with their own from/to/format, and adjust START_YEAR/END_YEAR to match your real timeline — the year label interpolates with the exact same linear formula as every metric. Pair with a scroll company timeline immediately after for a milestone-by-milestone follow-up to the aggregate growth story.
Build with AI
Build, Understand, Optimize, and Extend It With AI
Paste this snippet's HTML, CSS, and JS into an AI coding assistant like Claude and ask it to explain exactly why computing each metric's value as a linear interpolation of scroll progress, evaluated fresh every onUpdate frame, produces fundamentally different (and more precisely scrubbable) behavior than a triggered, fixed-duration count-up animation — and why that same technique guarantees the four metrics, the year label, and the progress bar can never drift out of sync with each other. The same assistant can help extend the pattern — ask it to add a non-linear interpolation curve for a metric that grew faster in later years, add a secondary set of counters that only start interpolating partway through the scroll range, or sync a background gradient shift to the same progress value used for the counters. Treat the code as a working starting point for your own scroll-scrubbed data narrative.
Prompt to recreate it
Copy this into your AI assistant of choice to build the effect from scratch, or as a jumping-off point for your own variant:
Build a "scroll data story counters" section in plain HTML, CSS, and JavaScript using GSAP with its ScrollTrigger plugin, loaded from a CDN with no bundler.

Requirements:
- A pinned full-viewport section containing a large background year label, a grid of several metric tiles (each with a large formatted numeric value and a label underneath), and a thin progress fill bar, preceded by an intro section and followed by an outro section.
- Store each metric's starting value, ending value, and a formatting function (for currency, abbreviated large numbers like K/M, or plain integers) in a single JavaScript array, rather than hardcoding formatting logic per element.
- Create a single ScrollTrigger on the pinned section with pin: true and a scrub value (a small fractional value like 0.3 for slight smoothing, not zero lag and not a large sluggish value), covering one fixed total pinned scroll distance.
- Inside that ScrollTrigger's onUpdate callback, for every metric in the array, compute its currently displayed value as a linear interpolation between its starting and ending value using the callback's own scroll progress fraction (from + (to - from) * progress) and update that metric's DOM text using its own formatting function — do not use any duration-based or triggered count-up animation for the metric values themselves.
- In the same onUpdate callback, compute a displayed year value using the identical linear interpolation formula between a start year and an end year, and update the fill bar's width from the same progress fraction, so every displayed number, the year label, and the fill bar are all guaranteed to derive from one single shared progress value with no possibility of drifting out of sync with each other.
- Confirm that scrolling to any arbitrary point within the pinned range, in either direction, produces exactly the same displayed values every time (since they are pure functions of scroll position), and that scrolling back up smoothly and precisely retreats every value with no separate reverse-animation logic required.
Want to tighten it up first? Run this prompt through the AI Prompt Studio to score it across 8 quality dimensions, catch anti-patterns, and tune the wording for Claude, ChatGPT, or Gemini before you paste it in.
Step by step
How to Use
- 1Add GSAP and ScrollTriggerLoad both from the CDN and call gsap.registerPlugin(ScrollTrigger).
- 2Paste the HTML, CSS, and JSCounters start at their "from" values and the year shows the start year.
- 3Scroll into the pinned sectionEvery counter and the year interpolate continuously with scroll position.
- 4Scroll to any point and stopNumbers land exactly on their computed value for that exact scroll position.
- 5Scroll back upValues retreat precisely — there's no count-up animation to "undo."
- 6Edit the METRICS arraySet from, to, and a format function per metric — the interpolation logic never changes.
Real-world uses
Common Use Cases
Got questions?
Frequently Asked Questions
A typical count-up counter plays a fixed-duration animation once, triggered the first time an element enters the viewport — the number always counts through the same fixed sequence regardless of exactly where or how you scrolled. This snippet instead computes each value as from + (to - from) * scrollProgress inside onUpdate, every single frame, so the displayed number is a direct, deterministic function of scroll position — stop scrolling at any point and the number is exactly, reproducibly correct for that position, with no animation duration or triggered state involved at all.
They're all computed inside the same onUpdate callback from the same self.progress value passed in by ScrollTrigger for that frame. Since there's only one progress number and every displayed value is a pure function of it, none of the outputs can ever drift out of sync with each other — unlike four independently-triggered count-up animations, which could easily finish at slightly different scroll positions if their durations or easings differ.
scrub: true (equivalent to 0) ties the tween's position to the scrollbar with zero lag — visually correct but can look jittery on a trackpad or a mouse wheel with uneven deltas. A small value like 0.3 tells GSAP to smooth the followed value over roughly 0.3 seconds, which absorbs that jitter. Because the pinned scroll range spans thousands of pixels, that small lag is imperceptible relative to the whole range — the "value equals position" behavior still holds for all practical purposes.
Add a new HTML element with a unique id for its value display, add a matching grid cell with a label, and add one new object to the METRICS array with that same el id, a from value, a to value, and a format function describing how to render the interpolated number. No other JavaScript needs to change — the array-mapping and onUpdate loop both operate generically over however many entries the METRICS array contains.
Create the ScrollTrigger inside a mount effect after the metric elements have rendered, and write each interpolated value as a direct textContent update inside onUpdate rather than through component state — updating state at scroll-frame frequency would trigger excessive re-renders. Keep the METRICS array and DOM node references in a ref (or module-level constant scoped to the component) and call the ScrollTrigger instance's .kill() in the cleanup function.