Learn Coding Visually
Learn to code with interactive, live-preview playgrounds — HTML, CSS, JavaScript, React & more.
 HTML Playground42 lessons · Click-based · Live preview
 CSS PlaygroundLearn CSS with a live editor
 JavaScript Playground60 lessons · DOM · Async · Canvas
 React PlaygroundLearn React with a live code editor
 GSAP PlaygroundLearn GSAP animation interactively
 SVG Playground44 lessons · shapes · paths · animation
 SCSS Playground45 lessons · Sass modules · tokens
 Tailwind PlaygroundLearn Tailwind CSS with a live editor
 Bootstrap 5 Playground50 lessons · live preview
Hero with Animated Stat Counters — Free HTML CSS JS Snippet
Hero with Animated Stat Counters · Heroes · Plain HTML, CSS & JS · Live preview
What's included
Features
About this UI Snippet
Hero with Animated Stat Counters — requestAnimationFrame Count-Up with Easing
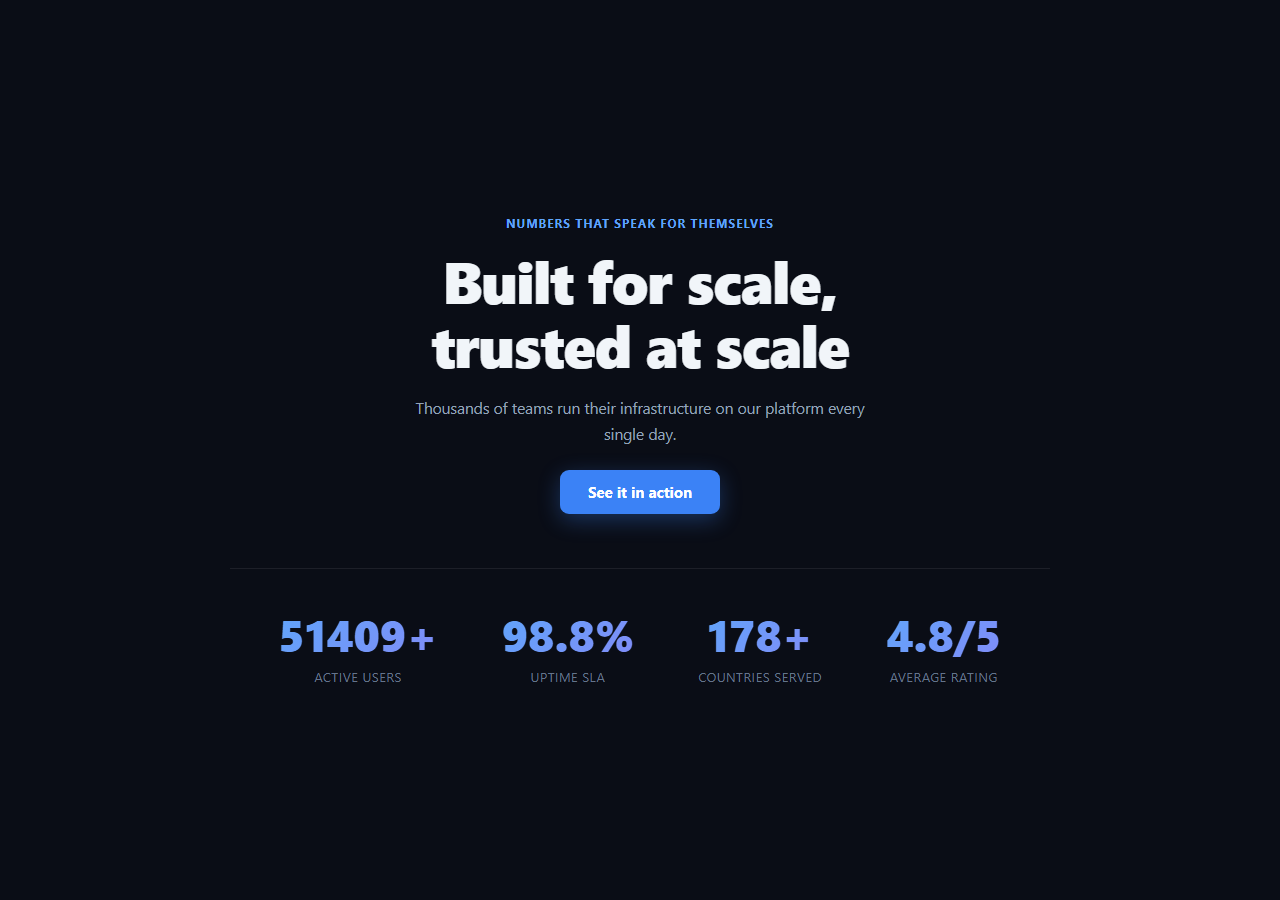
A row of stats that count up from zero is one of the fastest ways to communicate scale in a hero — but only if the animation is smooth and only fires once, at the right moment. This snippet drives each number with a real requestAnimationFrame loop and easing function, gated by an IntersectionObserver so the count-up starts exactly when the stats scroll into view.
Why requestAnimationFrame instead of setInterval
Each stat's animateCount() uses requestAnimationFrame recursively rather than a fixed-interval setInterval. requestAnimationFrame is synced to the browser's actual repaint cycle, so the animation naturally runs at the display's refresh rate (commonly 60fps or higher) without over- or under-shooting frames, and automatically pauses when the tab isn't visible — no manual visibility handling required.
Real easing, not a linear ramp
easeOutExpo() computes 1 - 2^(-10t) for progress t in [0,1] — a curve that starts fast and decelerates sharply into the final value, which reads as far more natural than a linear count where the number ticks up at a constant rate. Every frame recomputes current = target * eased from the *elapsed time*, not from incrementing the previous frame's value, so the animation duration stays exactly 1600ms regardless of frame rate or dropped frames.
Data-driven targets, no per-stat script
Each .stc-num element carries its own data-target, optional data-decimals, and optional data-suffix attributes ("52000+", "99.9%", "4.9/5") — one shared animateCount() function reads these to animate every stat with its correct precision and formatting, so adding a fifth stat means adding a fifth <span> with its own data-* values, not writing new JavaScript.
Fires once, at the right time
An IntersectionObserver watches the stats row and calls triggerIfNeeded() the first time it's 40% visible, then immediately disconnects — so the count-up plays once, when a visitor can actually see it, rather than firing on page load (before it's scrolled into view) or replaying every time it re-enters the viewport. A hasAnimated flag provides a second guard against double-triggering.
Tabular numbers for a stable layout
font-variant-numeric: tabular-nums keeps each digit's width fixed, so the stat labels beside and below the number don't jitter horizontally as the digits change 60 times a second during the animation.
Customizing it
Add more stats by copying a .stc-stat block with new data-* values, adjust duration or swap easeOutExpo for a different easing curve, or lower the threshold if you want the count-up to start as soon as the row is barely visible. Pair it with count-up or number ticker for a non-hero version of the same technique.
Build with AI
Build, Understand, Optimize, and Extend It With AI
Rather than tuning the count-up feel by trial and error, paste this snippet's HTML, CSS, and JS into an AI coding assistant like Claude and ask it to explain why animateCount() recomputes the current value from elapsed time and an easing function on every requestAnimationFrame call, rather than incrementing the displayed number by a fixed step each frame — and how that keeps the total duration accurate even with dropped frames. The same assistant can help you tune it — ask whether easeOutExpo is the right curve for a stat that should feel like it's "settling" versus one that should feel energetic, or whether the IntersectionObserver's 0.4 threshold triggers too early or too late for a hero-sized stats row. It's also useful for extending the pattern: ask it to add a subtle scale-and-fade entrance on the stat labels alongside the number count-up, support formatted large numbers with comma separators, or convert the vanilla implementation into a reusable React hook that exposes the current animated value. Treat the code less like a finished artifact and more like a starting point for a conversation.
Prompt to recreate it
Copy this into your AI assistant of choice to build the effect from scratch, or as a jumping-off point for your own variant:
Build a hero section in plain HTML, CSS, and vanilla JavaScript with a row of statistics that count up from zero to their real values using requestAnimationFrame with easing (no library, no CDN).

Requirements:
- A hero with headline, subheading, and CTA above a row of 4 stat blocks, each containing a large number and a small label. Each number element should carry data attributes for its final target value, optional decimal precision, and an optional suffix string (so stats can render as "52000+", "99.9%", or "4.9/5" using the same shared animation code).
- Write one shared animation function that reads a given element's data attributes and animates its displayed text from 0 up to the target value over a fixed duration (roughly 1.5-2 seconds), using requestAnimationFrame recursively (not setInterval) and computing the current interpolated value from actual elapsed time and an easing function on every frame — not by incrementing a running counter by a fixed step each frame, so the total duration stays correct even if frames are dropped.
- Use a real decelerating easing curve (such as an exponential ease-out) rather than a linear ramp, so the numbers visibly slow down as they approach their final value.
- Trigger all the stat animations exactly once, only when the stats row scrolls into the viewport, using an IntersectionObserver with a reasonable visibility threshold — disconnect the observer and guard with a boolean flag so scrolling the row in and out of view does not replay the count-up. Include a simple fallback (animate immediately) for environments without IntersectionObserver support.
- Use tabular number styling (font-variant-numeric: tabular-nums) on the stat numbers so the layout doesn't jitter as digits change rapidly during the animation.
Want to tighten it up first? Run this prompt through the AI Prompt Studio to score it across 8 quality dimensions, catch anti-patterns, and tune the wording for Claude, ChatGPT, or Gemini before you paste it in.
Step by step
How to Use
- 1Paste HTML, CSS, and JSStats start at 0 until the row scrolls into view.
- 2Scroll the stats row into viewEach number counts up over 1.6s with a real decelerating ease.
- 3Scroll away and backThe count-up does not replay — it plays exactly once via the observer + flag guard.
- 4Edit the stat valuesChange each data-target, data-decimals, and data-suffix attribute.
- 5Add a fifth statCopy a .stc-stat block with new data-* values — no JS changes needed.
- 6Tune the animationChange duration or swap easeOutExpo for a different curve.
Real-world uses
Common Use Cases
Got questions?
Frequently Asked Questions
requestAnimationFrame is synced to the browser's actual repaint cycle, so it naturally runs at the display's refresh rate without the frame-timing drift a fixed-interval setInterval can introduce, and it automatically pauses when the tab is backgrounded rather than continuing to fire uselessly. Since each frame recomputes the current value from elapsed time rather than incrementing a running total, the total animation duration stays accurate even if some frames are dropped.
An IntersectionObserver watches the stats row and fires a callback the first time at least 40% of it is visible in the viewport. That callback calls triggerIfNeeded(), which checks a hasAnimated flag to guarantee the count-up runs exactly once, then disconnects the observer — so scrolling the row in and out of view repeatedly does not replay the animation.
Each stat span carries data-target (the final numeric value), an optional data-decimals (defaults to 0), and an optional data-suffix (defaults to empty). Inside the animation loop, the current interpolated value is formatted with toFixed(decimals) and the suffix is appended as a plain string — so "99.9" with data-decimals="1" and data-suffix="%" renders as "0.0%" through "99.9%" as it animates, and a whole number like 52000 with data-suffix="+" renders as "52000+" at the end.
The script checks 'IntersectionObserver' in window before creating the observer. If it's unavailable, it calls triggerIfNeeded() immediately instead — so the stats still animate (just on load rather than on scroll-into-view) rather than staying frozen at zero in an unsupported environment.
Copy an existing .stc-stat block in the HTML, give the inner .stc-num span a new id and the appropriate data-target, data-decimals, and data-suffix attributes, and add a .stc-label span with its caption. Because animateCount() is applied to every element matching .stc-num via querySelectorAll, the new stat is picked up automatically.