Learn Coding Visually
Learn to code with interactive, live-preview playgrounds — HTML, CSS, JavaScript, React & more.
 HTML Playground42 lessons · Click-based · Live preview
 CSS PlaygroundLearn CSS with a live editor
 JavaScript Playground60 lessons · DOM · Async · Canvas
 React PlaygroundLearn React with a live code editor
 GSAP PlaygroundLearn GSAP animation interactively
 SVG Playground44 lessons · shapes · paths · animation
 SCSS Playground45 lessons · Sass modules · tokens
 Tailwind PlaygroundLearn Tailwind CSS with a live editor
 Bootstrap 5 Playground50 lessons · live preview
Heartbeat Pulse Monitor Loader — Free HTML CSS JS Snippet
Heartbeat Pulse Monitor Loader · Loaders · Plain HTML, CSS & JS · Live preview
What's included
Features
About this UI Snippet
Heartbeat Pulse Monitor Loader — ECG Waveform with a Sweeping Scan Head
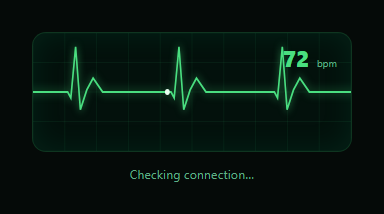
A heartbeat monitor loader mimics a hospital ECG display: a repeating spike-shaped waveform scrolls continuously across a dark screen, with a bright leading edge sweeping left to right and a bpm readout ticking nearby. Unlike a generic pulsing dot, this snippet draws an actual shaped waveform — a flat baseline, then a small dip, a sharp upward spike, a dip below baseline, and a rounded bump, matching the real QRS-complex shape of a heartbeat trace — repeated end-to-end so it reads unmistakably as "heartbeat" rather than an arbitrary wiggle.
Building one repeatable waveform unit
beatUnit(unitWidth) constructs a single beat as an ordered array of [x, y] points: a long flat segment (most of a real heartbeat cycle is a flat baseline between beats), followed by a small Q dip, a sharp R peak, an S dip below the baseline, and a rounded T wave, then a short flat tail padding the unit back out to its full width. This exact five-part shape — flat, small-dip, sharp-spike, dip, rounded-bump, flat — is what a real single-lead ECG trace looks like, and repeating this one unit via pathFromUnits(count, xOffset) is what produces a continuous, recognizably medical waveform instead of a looping sine wave.
Seamless infinite scroll with two trace layers
A dim, low-opacity trace (.hb-trace-dim) renders the full repeating waveform shape at rest across the whole visible width, giving the eye context for the shape even in the portion that hasn't "played" yet. A brighter, glowing live trace is layered on top but clipped with an SVG <clipPath> rect whose width grows with elapsed time — so the bright trace only ever shows up to the current sweep position, exactly like a real monitor where the newest sample is drawn and the sweep continues past what's already been shown. Both traces scroll using the same scrollX = (elapsed * pxPerMs) % UNIT_W calculation, so the waveform never visibly jumps or resets even though it loops indefinitely.
Deriving pixel speed from a real BPM value
Rather than an arbitrary animation duration, pxPerMs is derived directly from BPM: msPerBeat = 60000 / BPM, then pxPerMs = UNIT_W / msPerBeat. This means the waveform's visual scroll speed is mathematically tied to the displayed beats-per-minute number — changing BPM changes both the readout and the actual scroll speed together, keeping them honest with each other rather than being two independently-set values that happen to look plausible together.
A scan head that tracks the current waveform height
The small bright dot (scanHead) doesn't just travel in a straight horizontal line — its cy is set every frame by finding the nearest point in the unit array to the current sweep position within its cycle, so the dot visually rides along the top of the spike as it passes through, rising sharply during the R peak and dipping during the S trough, reinforcing that it's the leading edge actively drawing the trace rather than a decoration moving independently of it.
Subtle liveness details
The bpm readout jitters by a small random amount every 1.4 seconds and the status text below the monitor cycles through a short list of connection-themed phrases — small touches that keep a loading state that could run for many seconds from reading as visually frozen or fake.
Build with AI
Build, Understand, Optimize, and Extend It With AI
Paste this snippet's HTML, CSS, and JS into an AI coding assistant like Claude and ask it to explain exactly how beatUnit() encodes the flat-dip-spike-dip-bump shape of a real ECG trace as explicit point data, and how the shared scrollX calculation keeps the dim background trace and the clipped bright live trace perfectly synchronized into a seamless loop. It's also a good candidate for extension — ask it to tie the BPM value to a real async operation's elapsed time (speeding up the pulse the longer a request takes, for instance), add a flatline-then-recover animation for an error state, or add a second, differently-colored trace representing a secondary metric scrolling alongside the first.
Prompt to recreate it
Copy this into your AI assistant of choice to build the effect from scratch, or as a jumping-off point for your own variant:
Build an ECG-style "heartbeat monitor" loading indicator in plain HTML, CSS, and JavaScript — no libraries.

Requirements:
- Construct a single repeatable "heartbeat" waveform unit as explicit ordered point data (not a sine wave or random noise): a long flat baseline segment, a small downward dip, a sharp upward spike, a deeper dip below the baseline, a rounded bump, and a short flat tail padding it back to a fixed unit width — matching the general shape of a real single-lead ECG QRS complex.
- Render two copies of the repeating waveform as inline SVG paths built by tiling that one unit end-to-end: a dim, low-opacity background trace showing the full shape at rest, and a brighter, glowing "live" trace drawn on top.
- Continuously scroll both traces horizontally using a shared elapsed-time-based offset so the pattern loops seamlessly with no visible jump or reset at the wrap point.
- Clip the bright live trace with an SVG clip-path whose width grows over time to match a sweeping "scan head" x-position, so the bright trace is only ever visible up to the current sweep point — mimicking how a real ECG monitor draws new samples while the trace continues scrolling.
- Add a small bright dot at the current scan-head x-position whose vertical position tracks the actual waveform height at that point in its cycle (rising during the spike, dipping during the trough) rather than moving in a straight horizontal line.
- Derive the horizontal scroll speed directly from a beats-per-minute (BPM) constant using real time-per-beat math, and display that same BPM value as a live numeric readout, so the visual scroll speed and the displayed number are mathematically tied together rather than independently tuned.
- Add subtle random jitter to the displayed BPM number every second or two, and cycle a short status message beneath the monitor, so the loader reads as continuously live rather than a frozen static graphic.
Want to tighten it up first? Run this prompt through the AI Prompt Studio to score it across 8 quality dimensions, catch anti-patterns, and tune the wording for Claude, ChatGPT, or Gemini before you paste it in.
Step by step
How to Use
- 1Paste HTML, CSS, and JSAn ECG-style waveform scrolls continuously with a bright sweeping scan head and a live bpm readout.
- 2Watch the scan head trace the waveformThe leading dot rises and dips exactly along the spike shape as it sweeps, not in a straight line.
- 3Change the simulated heart rateEdit the BPM constant — both the readout and the actual scroll speed are derived from it together.
- 4Adjust the waveform shapeEdit the point arrays inside beatUnit() to change the spike height, dip depth, or flat-segment proportion.
- 5Recolor the themeEdit the green color values in the CSS for a different monitor palette.
- 6Customize the status textEdit the messages array in the JS panel to match your own loading copy.
Real-world uses
Common Use Cases
Got questions?
Frequently Asked Questions
beatUnit() builds one beat as an explicit ordered array of [x, y] points: a long flat baseline segment, a small downward Q dip, a sharp upward R peak, a deeper S dip below the baseline, a rounded T wave bump, then a short flat tail. This matches the real shape of a single-lead ECG trace, and pathFromUnits() repeats this one unit end-to-end to build the full scrolling waveform.
Both the dim background trace and the bright live trace are drawn from the exact same repeating unit and shifted by the same scrollX = (elapsed * pxPerMs) % UNIT_W value every frame. Because the waveform unit is periodic and the shift wraps at exactly one unit width, there is no discontinuity at the wrap point — the pattern simply continues.
msPerBeat is computed as 60000 / BPM (milliseconds per beat from beats-per-minute), and pxPerMs is then UNIT_W / msPerBeat — the width of one waveform unit divided by how long one beat should take. Changing the BPM constant changes both the readout and the actual pixel scroll speed together, since both derive from the same value.
Every frame, the scan head's vertical position is set by finding the point in the beatUnit array closest to the current position within its cycle, rather than staying fixed at the baseline height. This makes the leading dot visually ride along the top of the spike as it sweeps through it, reinforcing that it is the trace's actively-drawing edge.
An SVG clipPath contains a rect whose width is updated every frame to match the current sweep x-position (headX). The bright live trace path has that clip-path applied, so only the portion of the trace to the left of the current sweep position is visible in the bright color — everything to the right remains hidden until the sweep reaches it, exactly like a real ECG monitor's drawing behavior.
Precompute the beatUnit point array once (e.g. in useMemo) since it never changes, then run the requestAnimationFrame loop in a mount effect that updates the SVG path d attributes and the clip rect width via refs, with cleanup that cancels the animation frame and both intervals on unmount.