Source Code
<div class="wrap">
  <div class="table-top">
    <div class="table-info" id="info">Showing 1–10 of 48 results</div>
    <div class="per-page-row">
      <span>Rows per page:</span>
      <select class="per-page-sel" id="per-page" onchange="setPerPage()">
        <option>5</option>
        <option selected>10</option>
        <option>20</option>
      </select>
    </div>
  </div>

  <div class="table-scroll">
    <table class="tbl">
      <thead>
        <tr>
          <th>#</th><th>Name</th><th>Email</th><th>Role</th><th>Status</th>
        </tr>
      </thead>
      <tbody id="tbody"></tbody>
    </table>
  </div>

  <div class="pagination" id="pagination"></div>
</div>
* { box-sizing: border-box; margin: 0; padding: 0; }
body { font-family: system-ui, sans-serif; background: #f8fafc; min-height: 100vh; padding: 32px 20px; }
.wrap { max-width: 800px; margin: 0 auto; }
.table-top { display: flex; justify-content: space-between; align-items: center; margin-bottom: 12px; flex-wrap: wrap; gap: 8px; }
.table-info { font-size: 13px; color: #64748b; }
.per-page-row { display: flex; align-items: center; gap: 8px; font-size: 13px; color: #64748b; }
.per-page-sel { border: 1px solid #e2e8f0; border-radius: 7px; padding: 5px 10px; font-size: 13px; color: #374151; background: #fff; cursor: pointer; outline: none; }
.table-scroll { overflow-x: auto; border-radius: 12px; box-shadow: 0 1px 6px rgba(0,0,0,0.06); }
.tbl { width: 100%; border-collapse: collapse; background: #fff; }
.tbl thead tr { background: #f8fafc; }
.tbl th { padding: 10px 14px; text-align: left; font-size: 11px; font-weight: 700; letter-spacing: 0.5px; text-transform: uppercase; color: #64748b; border-bottom: 1px solid #e2e8f0; }
.tbl td { padding: 12px 14px; font-size: 13px; color: #374151; border-bottom: 1px solid #f1f5f9; vertical-align: middle; }
.tbl tbody tr:last-child td { border-bottom: none; }
.tbl tbody tr:hover { background: #fafafa; }
.badge { font-size: 11px; font-weight: 700; padding: 3px 9px; border-radius: 20px; }
.badge.active { background: rgba(34,197,94,0.1); color: #16a34a; }
.badge.inactive { background: rgba(148,163,184,0.1); color: #64748b; }
.pagination { display: flex; justify-content: center; align-items: center; gap: 4px; margin-top: 16px; flex-wrap: wrap; }
.page-btn { min-width: 34px; height: 34px; border-radius: 8px; border: 1px solid #e2e8f0; background: #fff; color: #475569; font-size: 13px; font-weight: 600; cursor: pointer; display: flex; align-items: center; justify-content: center; padding: 0 8px; transition: all 0.12s; }
.page-btn:hover:not(:disabled) { border-color: #6366f1; color: #6366f1; }
.page-btn.active { background: #6366f1; border-color: #6366f1; color: #fff; }
.page-btn:disabled { opacity: 0.35; cursor: default; }
.page-ellipsis { font-size: 13px; color: #94a3b8; padding: 0 4px; }// Generate 48 sample rows
const roles = ['Admin','Developer','Designer','Manager','Analyst'];
const data = Array.from({ length: 48 }, (_, i) => ({
id: i + 1,
name: ['Alex Johnson','Sara Miller','Raj Patel','Maya Kim','Chris Lee','Emma Davis','Tom Brown','Anna White'][i % 8] + (i > 7 ? ' ' + (Math.floor(i/8)+1) : ''),
email: 'user' + (i+1) + '@company.com',
role: roles[i % roles.length],
active: i % 3 !== 2,
}));
let page = 1;
let perPage = 10;
function render() {
const total = data.length;
const start = (page - 1) * perPage;
const end = Math.min(start + perPage, total);
const pages = Math.ceil(total / perPage);
const rows = data.slice(start, end);
document.getElementById('info').textContent =
'Showing ' + (start+1) + '–' + end + ' of ' + total + ' results';
// Rows
const tbody = document.getElementById('tbody');
tbody.innerHTML = rows.map(r =>
'<tr><td>' + r.id + '</td><td>' + r.name + '</td><td>' + r.email + '</td><td>' + r.role + '</td>' +
'<td><span class="badge ' + (r.active ? 'active' : 'inactive') + '">' + (r.active ? 'Active' : 'Inactive') + '</span></td></tr>'
).join('');
// Pagination
const pg = document.getElementById('pagination');
pg.innerHTML = '';
const addBtn = (label, target, disabled, active) => {
const btn = document.createElement('button');
btn.className = 'page-btn' + (active ? ' active' : '');
btn.textContent = label;
btn.disabled = disabled;
btn.onclick = () => { page = target; render(); };
pg.appendChild(btn);
};
addBtn('‹ Prev', page - 1, page === 1, false);
// Smart page range: always the first and last page, plus current ± 1.
// The Set dedupes (near the ends those overlap) and any gap becomes an ellipsis.
const show = new Set([1, pages, page, page-1, page+1].filter(p => p >= 1 && p <= pages));
let prev = 0;
[...show].sort((a,b)=>a-b).forEach(p => {
if (prev && p - prev > 1) { const el = document.createElement('span'); el.className = 'page-ellipsis'; el.textContent = '…'; pg.appendChild(el); }
addBtn(p, p, false, p === page);
prev = p;
});
addBtn('Next ›', page + 1, page === pages, false);
}
function setPerPage() {
perPage = +document.getElementById('per-page').value;
page = 1;
render();
}
render();Learn Coding Visually
Learn to code with interactive, live-preview playgrounds — HTML, CSS, JavaScript, React & more.
 HTML Playground42 lessons · Click-based · Live preview
 CSS PlaygroundLearn CSS with a live editor
 JavaScript Playground60 lessons · DOM · Async · Canvas
 React PlaygroundLearn React with a live code editor
 GSAP PlaygroundLearn GSAP animation interactively
 SVG Playground44 lessons · shapes · paths · animation
 SCSS Playground45 lessons · Sass modules · tokens
 Tailwind PlaygroundLearn Tailwind CSS with a live editor
 Bootstrap 5 Playground50 lessons · live preview
Pagination Table — Free HTML CSS JS Snippet
Pagination Table · Tables · Plain HTML, CSS & JS · Live preview
What's included
Features
About this UI Snippet
Pagination Table — Client-Side Pagination, Smart Page Numbers, Per-Page Select & Showing X–Y of Z
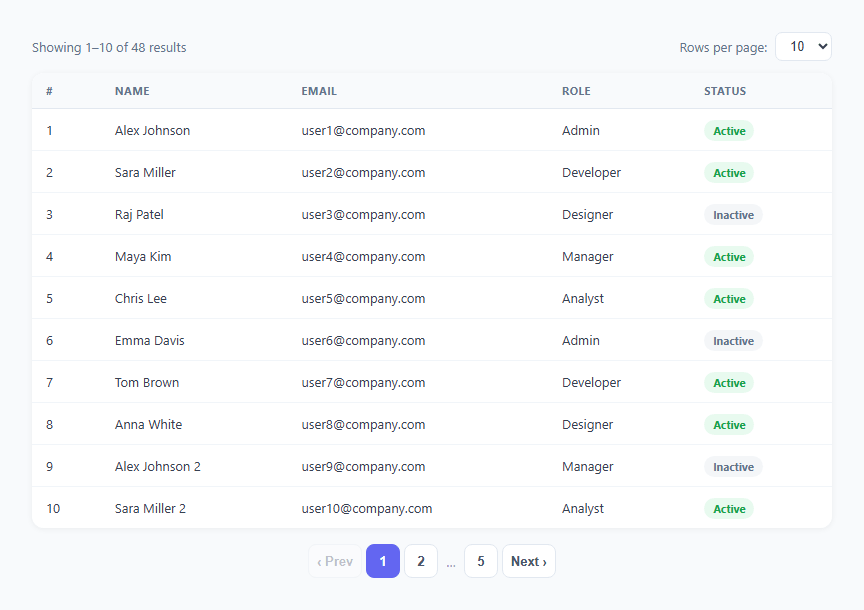
Pagination is essential for any data table that displays more rows than fit on one screen. Without it, users must scroll through hundreds of rows to find what they need. With well-implemented pagination, users can navigate between pages, control the number of rows shown, and see exactly where they are in the dataset. This snippet provides a complete client-side paginated table: smart page number buttons with ellipsis, prev/next navigation, a rows-per-page selector, and a "Showing X–Y of Z results" info display.
How client-side pagination works
The full dataset (48 sample rows) is stored in a JavaScript array. The render() function computes the current page slice: start = (page-1) * perPage, end = min(start + perPage, total). data.slice(start, end) extracts the visible rows. The function rebuilds the tbody innerHTML and the pagination controls on every page change.
Smart page number range with ellipsis
Instead of showing all page numbers (which would overflow for large datasets), the pagination shows: page 1 (always), pages around the current page (current-1, current, current+1), and the last page (always). Gaps between these numbers are filled with an ellipsis "…" element. A Set deduplicates and sorts the visible page numbers. This pattern matches the standard pagination used by Google, GitHub, and most admin dashboards.
Rows per page selector
A select element offers 5, 10, and 20 rows. Changing the selection calls setPerPage() which updates the perPage variable, resets page to 1, and calls render(). This ensures the user always sees page 1 after changing the row count — they are not left on a page that no longer exists.
The info bar
"Showing 1–10 of 48 results" gives users exact orientation within the dataset. The numbers update dynamically: the start of the current slice (1-indexed), the end of the current slice, and the total count. This pattern appears in virtually every production data table interface.
Customising with real data
Replace the data array with your real data from an API. For server-side pagination, change the fetch call to include page and perPage as query parameters. The render() function receives the total count from the API response header (X-Total-Count or paginated response body) and computes page buttons from that total.
Build with AI
Build, Understand, Optimize, and Extend It With AI
You don't have to hand-simulate the page-range algorithm to understand it. Paste this snippet's HTML, CSS, and JS into an AI coding assistant like Claude and ask it to explain exactly how the Set built from 1, pages, page-1, page, and page+1 produces the visible page-number buttons, and why sorting and diffing consecutive entries in that Set is what decides where an ellipsis gets inserted. The same assistant can help optimize it, for example asking whether rebuilding the entire tbody innerHTML on every page change is fine for 48 rows but should switch to patching only changed rows if the dataset grows into the thousands. It's also useful for extending the table: ask it to add a search input that filters the data array before slicing so pagination and the results count stay correct together, wire data.slice up to a real fetch call for server-side pagination, or add column sorting that runs before the page slice is taken. Treat the code less like a finished artifact and more like a starting point for a conversation.
Prompt to recreate it
Copy this into your AI assistant of choice to build the effect from scratch, or as a jumping-off point for your own variant:
Build a client-side "paginated data table" in plain HTML, CSS, and JavaScript, with no pagination library — pagination must be computed purely from array slicing and a Set-based page-range algorithm.

Requirements:
- An in-memory array of row objects (id, name, email, role, status) as the full dataset, plus a page variable and a perPage variable, both starting at sensible defaults.
- A single render function that computes start as (page minus 1) times perPage and end as the minimum of start plus perPage and the total row count, takes data.slice(start, end) as the currently visible rows, and rewrites the table body's rows from that slice.
- The same render function must rebuild the pagination controls: a Previous button disabled on the first page, a Next button disabled on the last page, and page-number buttons generated from a Set containing exactly the first page, the last page, and the current page along with its immediate neighbor page numbers, deduplicated and sorted; whenever two consecutive numbers in that sorted set differ by more than 1, insert an ellipsis element between their buttons instead of every number in between.
- A rows-per-page select control (offering at least three options) that, on change, updates perPage, resets page back to 1, and calls render — the row count must never leave the user stranded on a now-nonexistent page.
- An info line above the table that reads "Showing X to Y of Z results", recomputed from the same start/end/total values on every render.
- Give each row a status badge (e.g. Active/Inactive) styled differently by status, and make the table wrapper horizontally scrollable for narrow viewports.
Want to tighten it up first? Run this prompt through the AI Prompt Studio to score it across 8 quality dimensions, catch anti-patterns, and tune the wording for Claude, ChatGPT, or Gemini before you paste it in.
Step by step
How to Use
- 1Click page numbers or Prev/Next to navigateThe table re-renders to the selected page. The page number button gets an active indigo style. Prev and Next buttons disable when at the first or last page respectively.
- 2Change rows per pageSelect 5, 10, or 20 from the dropdown. The table resets to page 1 with the new row count. The "Showing X–Y of Z" info updates to reflect the new per-page slice.
- 3Replace the sample data arrayIn the JS panel, replace the data array at the top with your own data. Each object needs the properties displayed in the table columns. The pagination and info bar update automatically from data.length.
- 4Implement server-side paginationReplace data.slice(start,end) with a fetch call: fetch("/api/users?page="+page+"&limit="+perPage). Use the API response total count to compute pages: pages = Math.ceil(totalFromApi / perPage). Render the API rows into the tbody.
- 5Add column sortingSee the Sortable Table snippet in this library. Both use the same table structure. Add data-col and data-type attributes to th elements and the sortBy() function to sort the data array before slicing for the current page.
- 6Export in your formatClick "HTML" for a standalone file, "JSX" for a React component with useState for page and perPage and a useMemo for the visible slice, or "Tailwind" for a Tailwind CSS version.
Real-world uses
Common Use Cases
Got questions?
Frequently Asked Questions
The algorithm creates a Set containing: 1 (always show first page), pages (always show last page), and page-1, page, page+1 (show current page and neighbours). It filters out values below 1 or above pages. The Set deduplicates (e.g., if page=1, both 1 and page-1=0 are in the input but only 1 makes it through the filter). The sorted array is iterated, and when a gap greater than 1 exists between consecutive numbers, an ellipsis element is inserted.
Remove the data array and data.slice() call. In render(), add: const res = await fetch("/api/rows?page="+page+"&limit="+perPage); const { rows, total } = await res.json(); const pages = Math.ceil(total / perPage). Render rows to the tbody from the API response. Update the info bar from total. The pagination button generation code stays exactly the same — it only needs total and pages, which now come from the API response instead of data.length.
Add a search input above the table. On every input event, filter the data array: const filtered = data.filter(r => r.name.toLowerCase().includes(q) || r.email.toLowerCase().includes(q)). Reset page to 1 on each search. Use filtered instead of data in the render() calculations: start = (page-1)*perPage, rows = filtered.slice(start, end), pages = Math.ceil(filtered.length/perPage). The pagination and info bar automatically reflect the filtered subset.
Click "JSX" to download. Manage page and perPage with useState. Use useMemo to compute the visible rows slice: const visible = useMemo(() => data.slice((page-1)*perPage, page*perPage), [page, perPage]). Use another useMemo for totalPages: Math.ceil(data.length/perPage). Derive the page number range in useMemo as well. Reset page to 1 in useEffect when perPage changes: useEffect(() => setPage(1), [perPage]).